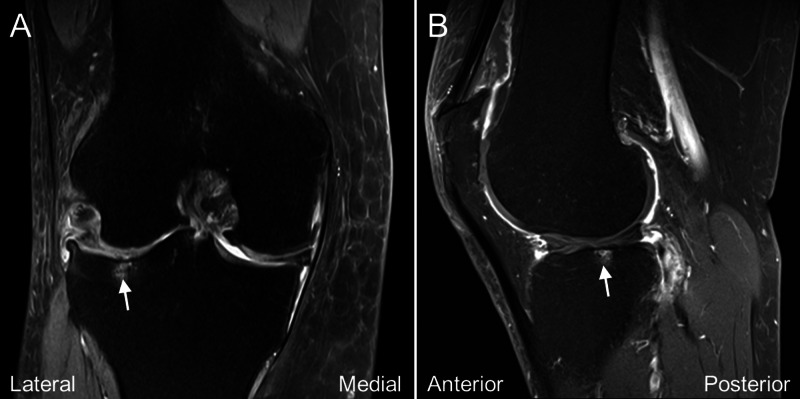
Figure 2. Magnetic resonance imaging of the patient's symptomatic knee joint before treatment.
The coronal (A) and sagittal (B) fat-sat T2 weighted magnetic resonance imaging of the knee joint revealed subchondral bone marrow high signal intensity (arrow) of the lateral tibial plateau along with medial and lateral meniscal tears.

