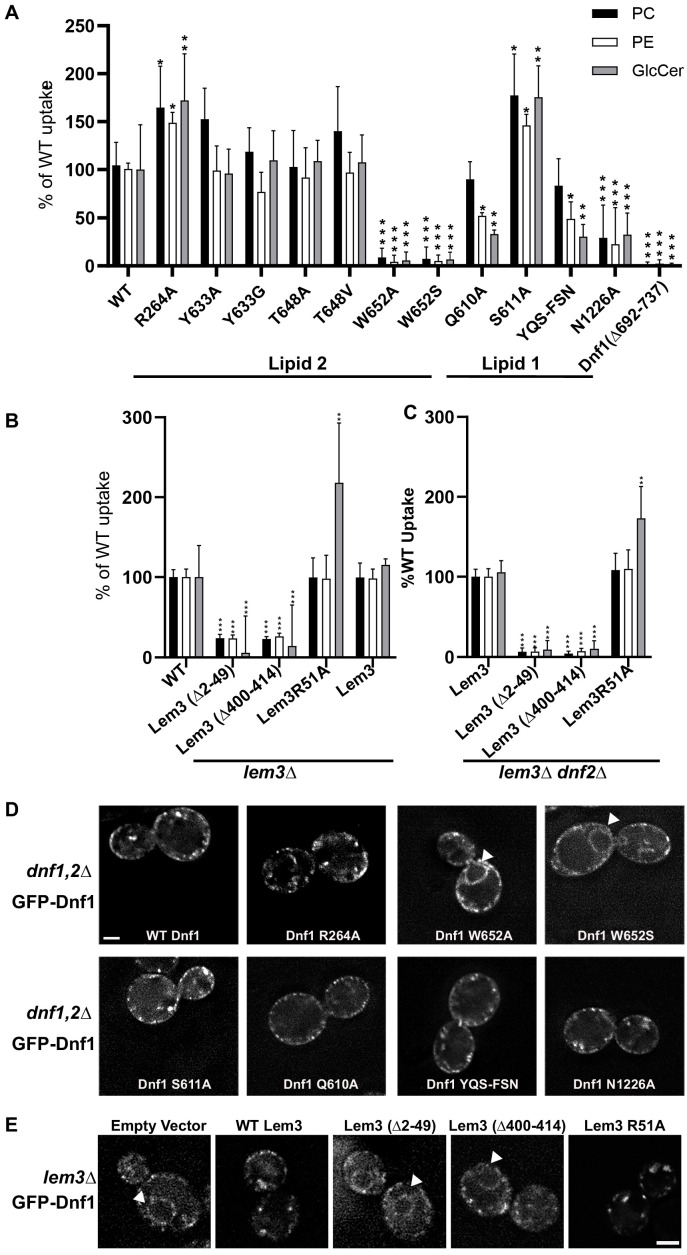
Figure 4. Influence of lipid=-binding site mutations on Dnf1 transport activity and localization.
(A) NBD-lipid uptake catalyzed by Dnf1 variants expressed on a dnf1,2∆ strain background. (B) NBD-lipid uptake catalyzed by Lem3 variants expressed on a lem3∆ background, in which lipid transport is mediated primarily by Dnf2–Lem3. (C) NBD-lipid uptake catalyzed by Lem3 variants expressed on a lem3∆ dnf2∆ background to assay the influence of Lem3 mutations solely on Dnf1 activity. In (A–C), cells were incubated with NBD-lipids for 30 min and uptake was measured by flow cytometry. The value represents percentage uptake of NBD-lipid in comparison to WT Dnf1 (A) or WT Lem3 (B–C) for each substrate lipid. The variance was assessed with one-way ANOVAs, and comparison to WT was calculated with Tukey’s post hoc analysis. n ≥ 9,± SD, * indicates p<0.05, **p<0.01, ***p<0.001. (D) Localization of GFP-tagged Dnf1 variants expressed in dnf1,2∆ cells. (E) WT Dnf1-GFP co-expressed with Lem3 variants. Arrowheads indicate nuclear envelope/endoplasmic reticulum location. Scale bar = 2 μm (n = 40).
Figure 4—figure supplement 1. Expression levels of Dnf1 variants.

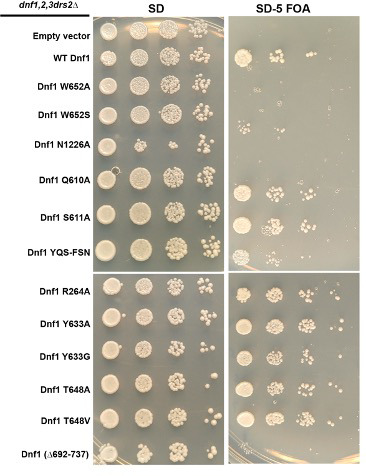
Figure 4—figure supplement 2. Ability of Dnf1 variants to support viability of flippase-deficient cells.


