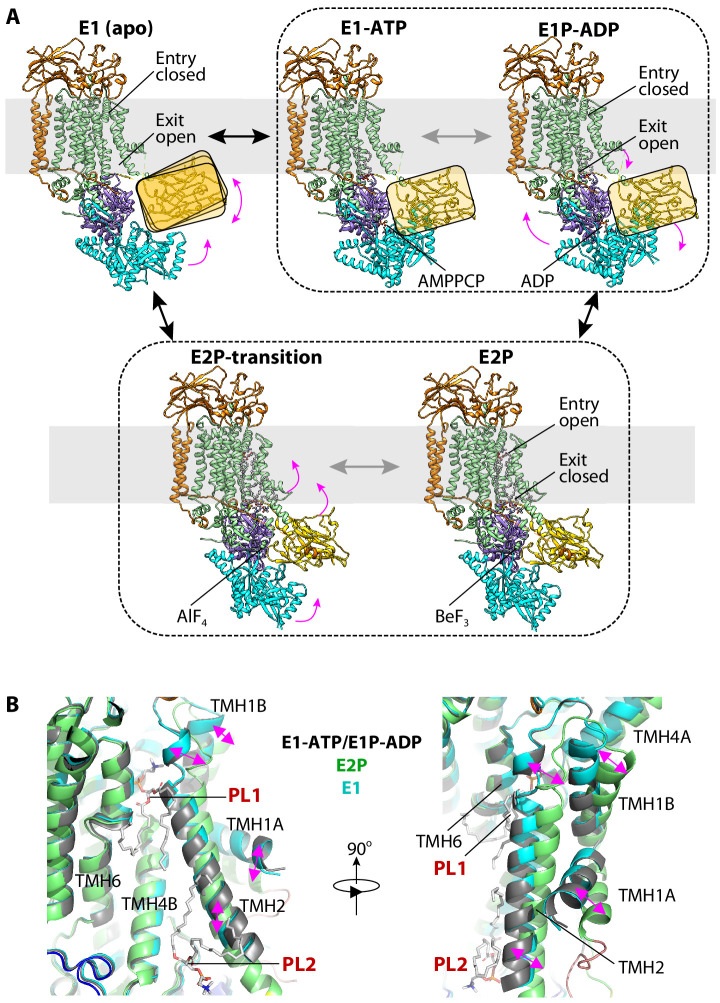
Figure 5. The ATP-dependent transport cycle of Dnf1–Lem3 and Dnf2–Lem3.
(A) The five structures of Dnf1 and Dnf2 in the E1 (apo), E1-ATP (AMPPCP), E1P-ADP (AlF4−-ADP), E2P-transition (AlF4−), and E2P (BeF3−) states. The A domain in the E1, E1-ATP, and E1P-ADP states is flexible and is shown here as a ribbon in the yellow rectangle to indicate its position. The structures of the E1-ATP and E1P-ADP states within the black dashed box are almost identical. The structures of the E2P and E2P-transition states are similarly grouped for the same reason. Magenta arrows indicate the domain movement during the Post–Albers cycle in the order E1 to E1-ATP to E1P-ADP to E2P/E2P-transition. (B) Structural comparison of the substrate-binding sites in the E1, E1P-ADP, and E2P states. TMH1-2 in the E1 and E1P-ADP states tilt with respect to that in the E2P state; this movement closes the PL1 site and opens the PL2 site.
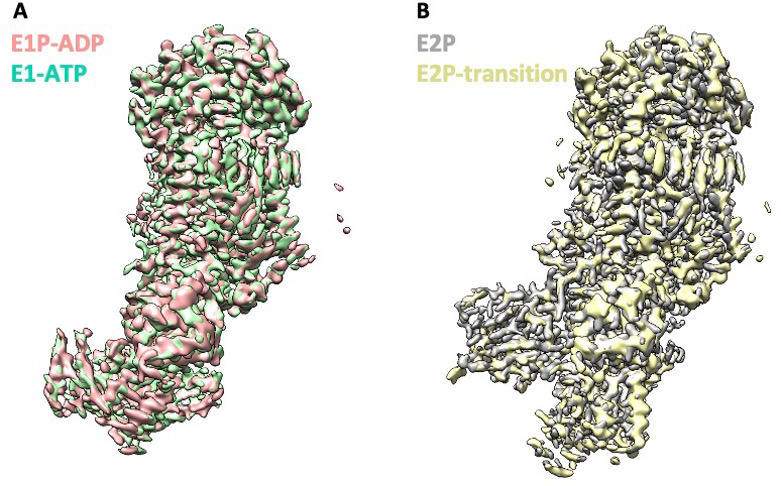
Figure 5—figure supplement 1. High structural similarity between Dnf1 and Dnf2 in the corresponding substrate-transport states.

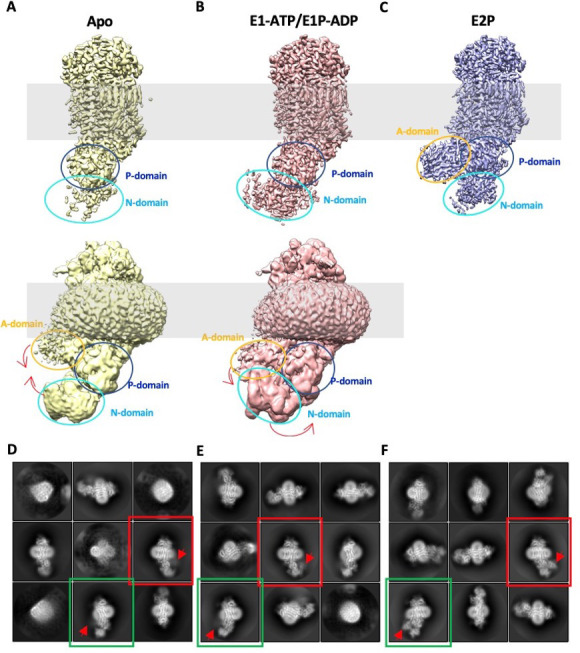
Figure 5—figure supplement 2. The N and A domain densities are weak in the 3D maps of Dnf1–Lem3 in the E1 and E1P-ADP states, indicating their high flexibility.


