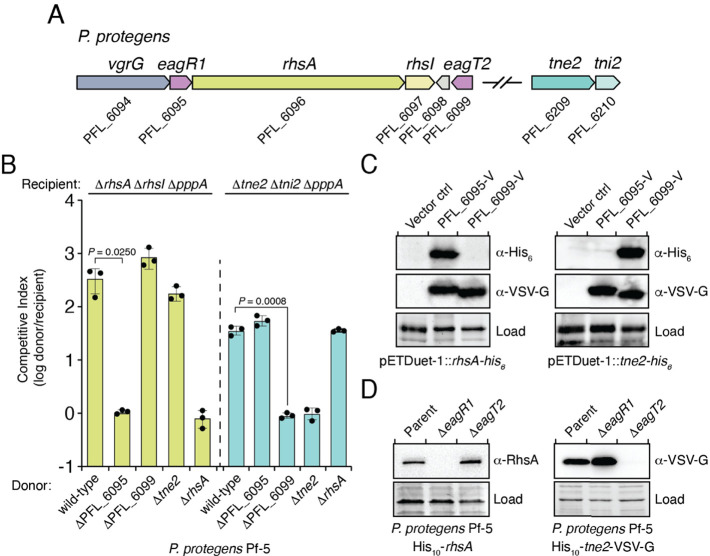
Figure 2. Eag chaperones are specific for their cognate prePAAR effector and are necessary for effector stability in vivo.
(A) Genomic context of two prePAAR-containing effector-immunity pairs from P. protegens Pf-5. RhsA is a class I effector (shown in green) and Tne2 is a class II effector (shown in blue). Shading is used to differentiate effector (dark) and immunity genes (light). Predicted eag genes are shown in purple. (B) Outcome of intraspecific growth competition assays between the indicated P. protegens donor and recipient strains. Donor strains were competed with recipient strains lacking rhsA-rhsI (green) or tne2-tni2 (blue). Both recipients are lacking pppA to stimulate type VI secretion. Data are mean ± s.d. for n = 3 biological replicates and are representative of two independent experiments; p values shown are from two-tailed, unpaired t-tests. (C) Western blot analysis of E. coli cell lysates from cells expressing the indicated effectors (RhsA or Tne2) and either empty vector, PFL_6095 V or PFL_6099 V. (D) Affinity-tagged RhsA or Tne2 were purified from cell fractions of the indicated P. protegens strains and visualized using western blot analysis. Deletion constructs for each eag gene were introduced into each of the indicated parent backgrounds. A non-specific band present in the SDS-PAGE gel was used as a loading control. (C–D) Data are representative of two independent experiments.
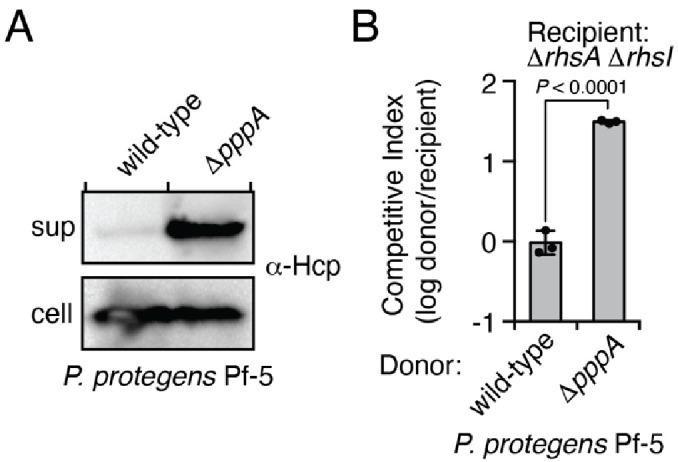
Figure 2—figure supplement 1. The type VI secretion system of P. protegens Pf-5 is repressed by the threonine phosphorylation pathway.


