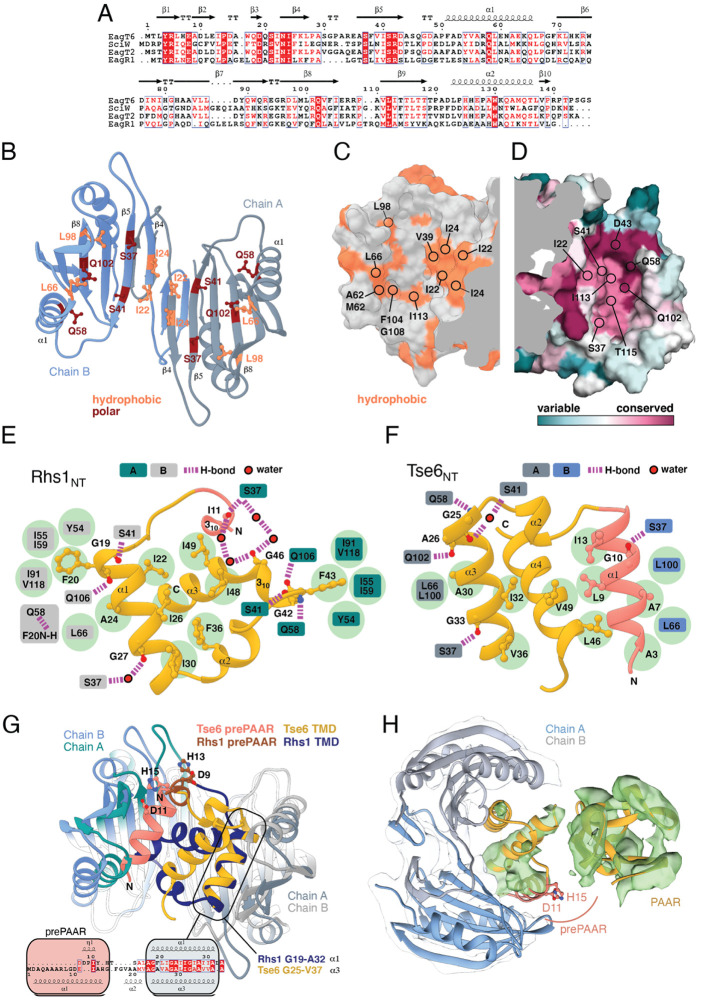
Figure 5. Eag chaperones interact with effector TMDs by mimicking interhelical interactions of alpha helical membrane proteins.
(A) Alignment of Eag chaperones that interact with class I (SciW, EagR1) or class II (EagT6 and EagT2) prePAAR effectors plotted with secondary structure elements. (B) Residues making intimate molecular contacts with their respective TMDs that are conserved among SciW, EagR1, EagT6, and EagT2 are shown. Hydrophobic contacts are colored in light orange and polar contacts in deep red. Residue numbers are based on EagT6. (C and D) The conserved hydrophobic molecular surface of the chaperones is shown in light orange (C) and their molecular surface residue conservation is shown as determined by the Consurf server (D) (Ashkenazy et al., 2016). Conserved residues making contacts with the TMDs in both co-crystal structures are shown. (E) Molecular contact map of Rhs1NT (residues 1–59) and SciW. prePAAR is shown in pink and the TMD regions in gold. Amino acids making contacts with the conserved residues of the Eag chaperones are shown by side chain/and or by main chain atoms (red for oxygen and blue for nitrogen). Residues in the Eag chaperone are highlighted by color of chain A or B. Polar (H-bond) contacts are drawn with a purple dashed line and are made with the side chain of the listed Eag residue. Outlined red circles indicate a water molecule. Light green circles indicate van der Waals interactions and hydrophobic interactions. The central group of hydrophobic residues without a listed chaperone residue all pack into the Eag hydrophobic face in Figure 4G (EagT6 I22/24 and V39). (F) Molecular contact map of Tse6NT (residues 1–61) and EagT6. Schematic is the same as panel B. Q102 in EagT6 corresponds to Q106 in SciW. (G) Structural alignment of SciW-Rhs1NT and EagT6-Tse6NT co-crystal structures using the structurally conserved TM helix as a reference. Eag chain coloring is the same as Figure 4. Rhs1NT is colored in dark blue with a brown prePAAR and Tse6NT in gold with a pink prePAAR. The conserved solvent accessible prePAAR residues D9/11 and H13/15 are shown in ball and stick model. Inset sequence alignment reflects the structurally aligned residues of Rhs1NT (top) and Tse6NT (bottom) as calculated by UCSF Chimera (Pettersen et al., 2004). Secondary structural elements are labeled. (H) Docking of the EagT6-TMD crystal structure from Figure 4C into the previously obtained cryo-EM density map of the EagT6-Tse6-EF-Tu-Tsi6-VgrG1a complex (EMD-0135). Cryo-EM density corresponding to EagT6 is depicted in transparent gray and Tse6-TMD and Tse6-PAAR in green; prePAAR residues are shown in pink. Note that Tse6-TMD was docked independent of EagT6 into the Tse6 density. One of three possible orientations for the PAAR domain is shown.
Figure 5—figure supplement 1. Structural comparison of Eag chaperones and effector complexes.


