. 2020 Dec 22;9:e58037. doi: 10.7554/eLife.58037

Figure 2. Reactivation triggered by forskolin involves a DLK/JNK-dependent phase I of viral gene expression.

(A) Reactivation was induced by forskolin in the presence of JNK inhibitor SP600125 (20 μM). (B) Reactivation was induced by forskolin in the presence of the DLK inhibitor GNE-3511 (4 μM). In A and B each experimental replicate is shown. (C) Reactivation was induced by forskolin or superinfection with a wild-type (F strain) HSV-1 (MOI of 10 PFU/cell) and qualified based on Us11-GFP-positive neurons (n = 3). (D–F) RT-qPCR for viral mRNA transcripts following forskolin treatment of latently infected SCGs. (G–I) RT-qPCR for viral lytic transcripts at 20 hr post-forskolin treatment and in presence of the JNK inhibitor SP600125 (20 μM) and the DLK inhibitor GNE-3511 (4 μM). (J) Neurons were transduced with a non-targeting shRNA control lentivirus or two independent lentiviruses expressing shRNAs that target DLK (shDLK-1, shDLK-2). Western-blotting for DLK or β-III tubulin was carried out 3 days post transduction. The percentage knock-down of DLK normalized to β-III tubulin is shown. (K and L) RT-qPCR for viral mRNA transcripts following forskolin treatment of latently infected SCGs that were either transduced with the shRNA control or shRNA DLK lentiviruses. In D-I, K, and L, each experimental replicate is represented. Statistical comparisons were made using a one-way ANOVA with a Tukey’s multiple comparison. *p<0.05, **p<0.01, ***p<0.001. The mean and SEM are shown.

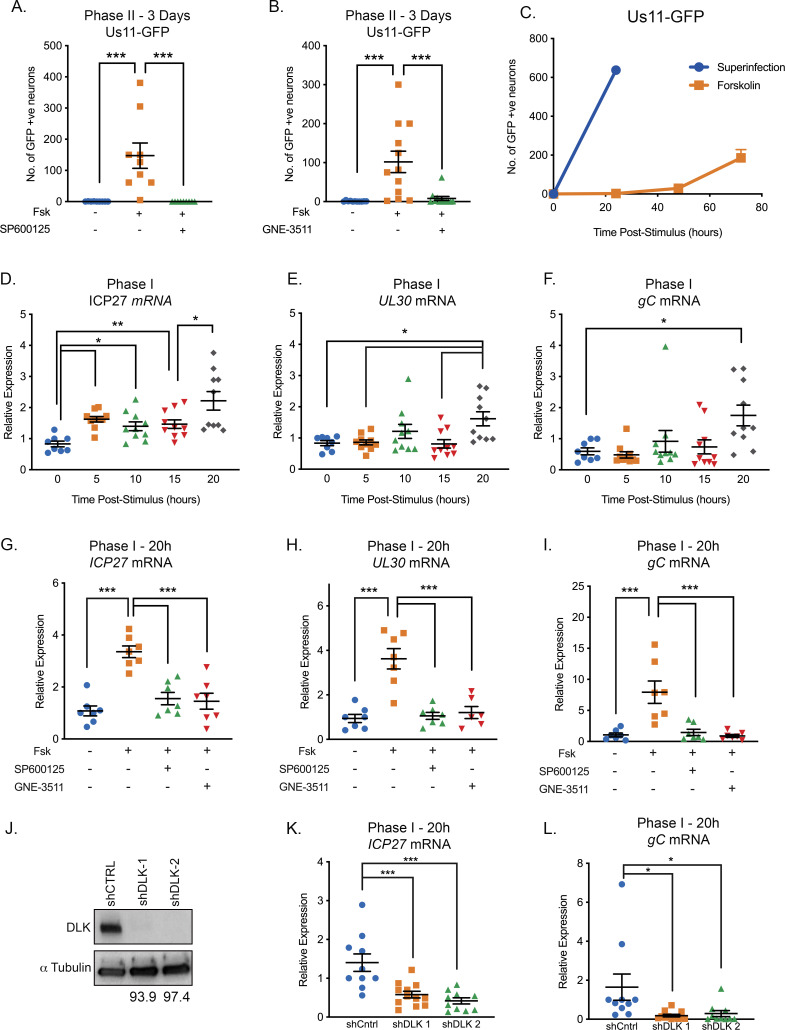
Figure 2—source data 1. Quantification of GFP-positive neurons, RT-qPCR and western blot band densities for Figure 2.

Figure 2.

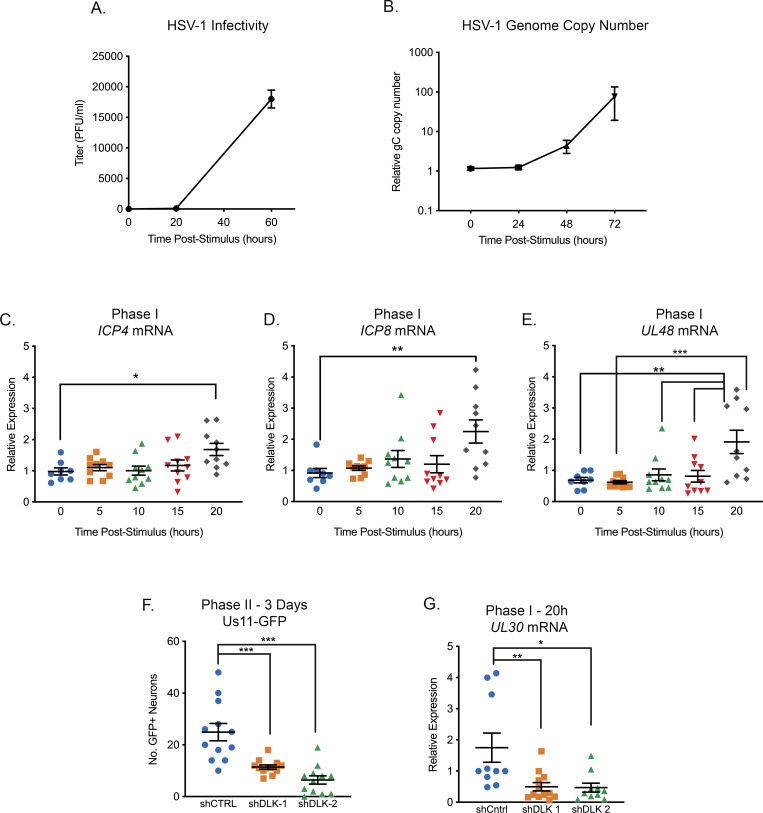
Figure 2—figure supplement 1. Reactivation triggered by forskolin triggers a wave of lytic gene expression that precedes DNA Replication and infectious virus production.

Figure 2—figure supplement 1.

(A) Titers of infectious virus detected from reactivating neurons induced with forskolin (n = 4). (B) Quantification of the relative viral genome copy number following forskolin-mediated reactivation based on gC copy number normalized to cellular GAPDH and expressed relative to the 0 hr time-point (n = 7). (C–E) RT-qPCR for viral mRNA transcripts following forskolin treatment of latently infected SCGs. (F) Quantification of Us11-GFP neurons and (G) RT-qPCR for UL30 mRNA transcript following forskolin treatment of latently infected SCGs that were either transduced with the shRNA control or shRNA DLK lentiviruses. Statistical comparisons were made using a one-way ANOVA with a Tukey’s multiple comparison. *p<0.05, **p<0.01, ***p<0.001. (C–E) In C-G each biological replicate is represented. The means and SEMs are shown.
Figure 2—figure supplement 1—source data 1. Quantification of HSV titer, GFP-positive neurons and RT-qPCR for Figure 2—figure supplement 1.
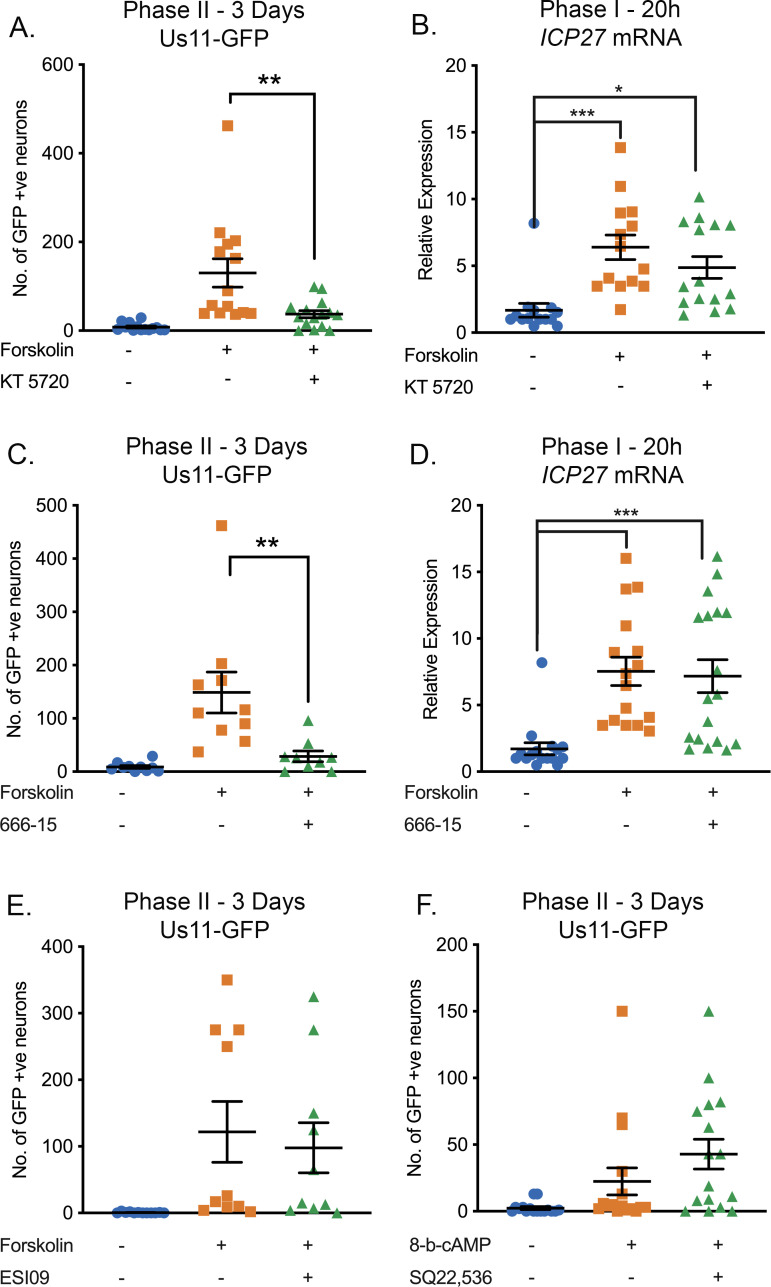
Figure 2—figure supplement 2. Effect of PKA, CREB, Rapgef2 and EPAC Inhibition on HSV-1 Reactivation.

Figure 2—figure supplement 2.

(A) Latently infected cultures were reactivated with forskolin (60 μM) in the presence of the PKA inhibitor KT 5720 (3 µM) and the number of Us11-GFP-positive neurons quantified at 3 days post-reactivation. (B) RT-qPCR for the viral lytic transcript ICP27 at 20 hr post-forskolin treatment and in the presence of KT 5720. (C) Latently infected cultures were reactivated with forskolin in the presence of the CREB inhibitor 666–15 (2 µM). (D) RT-qPCR for ICP27 at 20 hr post-forskolin treatment and in the presence of 666–15. (E) Latently infected cultures were reactivated with forskolin (60 μM) in the presence of the EPAC inhibitor ESI09 (10 µM). (F) Latently infected cultures were reactivated with 8-Bromo-cAMP (125 μM) in the presence of the Rapgef2 inhibitor SQ22,536 (50 µM). Individual experimental replicates are represented along with the means and SEMs. Statistical comparisons were made using a one-way ANOVA with a Tukey’s multiple comparison. *p<0.05, **p<0.01, ***p<0.001.
Figure 2—figure supplement 2—source data 1. Quantification of GFP-positive neurons and RT-qPCR for Figure 2—figure supplement 2.