. 2020 Dec 22;9:e58037. doi: 10.7554/eLife.58037

Figure 3. The Initial wave of viral lytic gene expression during forskolin-mediated reactivation is independent on histone demethylase activity.

(A) Quantification of the percentage of genome foci stained using click-chemistry that co-localize with H3K9me3/S10p. At least 15 fields of view with 1–8 genomes per field of view were blindly scored from two independent experiments. Data are plotted around the median, with the boxes representing the 25th–75th percentiles and the whiskers the 1st-99th percentiles. (B) Representative images of click-chemistry based staining of HSV-EdC genomes and H3K9me3/S10p staining at 5 hr post-forskolin treatment. (C and D). Effect of the LSD1 inhibitors OG-L002 and S 2101 on forskolin-mediated Phase I of reactivation determined by RT-qPCR for ICP27 (C) and gC (D) viral lytic transcripts at 20 hr post-forskolin treatment and in the presence of 15 μM OG-L002 and 20 μM S 2102. (E) Effect of the JMJD3 and UTX inhibitor GSK-J4 (2 μM) on forskolin-mediated Phase I measured by RT-qPCR for viral lytic transcripts ICP27 (E) and gC (F) at 20 hr post-forskolin treatment and in the presence of GSK-J4. For C-F each experimental replicate along with the mean and SEM is represented. (C–F). Statistical comparisons were made using a one-way ANOVA with a Tukey’s multiple comparison. *p<0.05, **p<0.01, ***p<0.001.

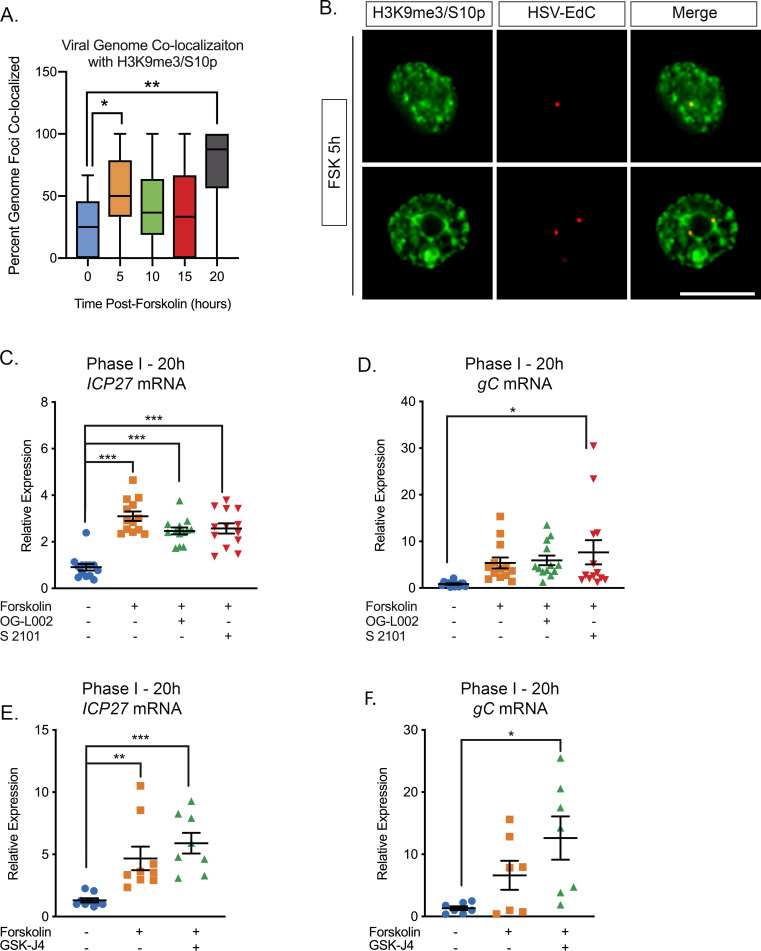
Figure 3—source data 1. Quantification of genome co-localization and RT-qPCR for Figure 3.

Figure 3.

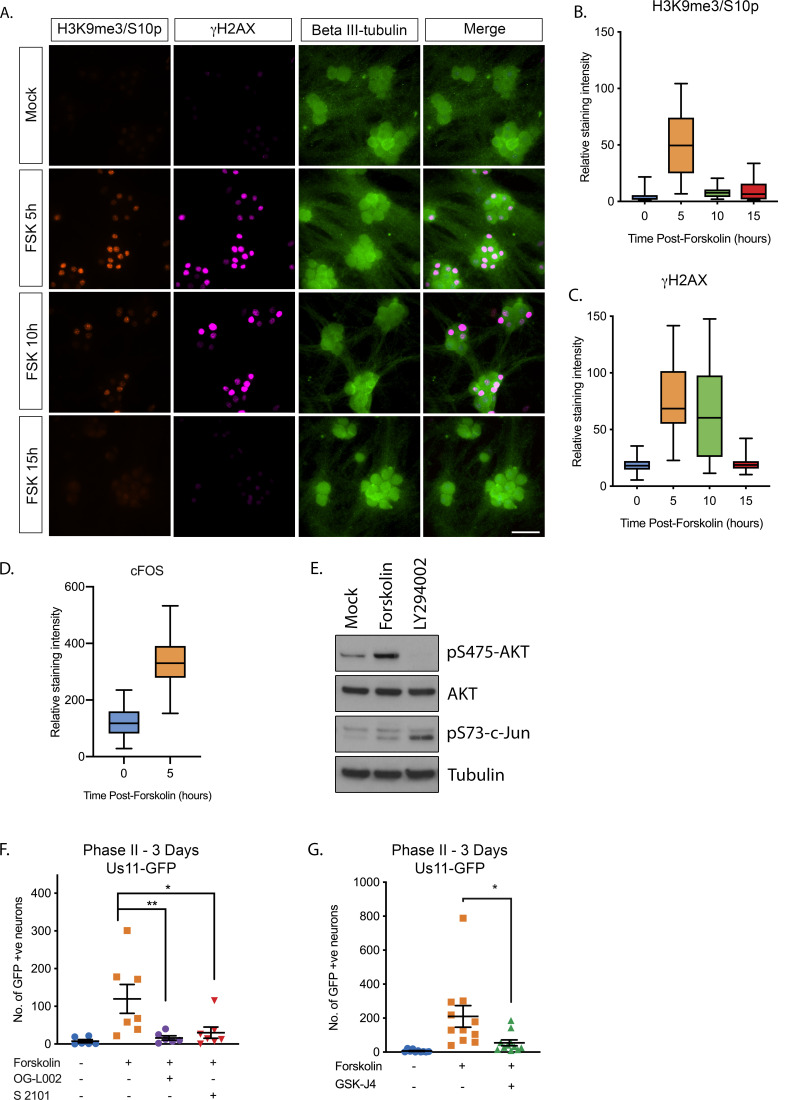
Figure 3—figure supplement 1. Forskolin induces hyperexcitability-associated chromatin changes, and hsv reactivation that requires histone demethylase.

Figure 3—figure supplement 1.

(A) SCG neurons were treated with forskolin and immunofluorescence staining was carried out for H3K9me3/S10p, the DNA damage marker γH2AX and the neuronal marker beta III-tubulin. (B) Quantification of neuronal nuclear staining intensity for H3K9me3 (>150 cells/condition). (C) Quantification of neuronal nuclear staining for γH2AX. In B and C data are plotted around the median and whiskers represent the 2.5–97.5 percentile range. (D). Western blotting for pS475-AKT, total AKT, pS73-c-Jun and tubulin at 15 hr post-treatment with the PI3-kinase inhibitor LY294002 (20 µM) or forskolin (60 µM) (E). Effect of the LSD1 inhibitors OG-L002 (15 μM) and S 2101 (20μM) on forskolin-mediated reactivation measured by Us11-GFP-positive neurons (F). Effect of the JMJD3 and UTX inhibitor GSK-J4 (2 μM) on forskolin-mediated reactivation measured by Us11-GFP-positive neurons (G). Statistical comparisons were made using a one-way ANOVA with a Tukey’s multiple comparison. *p<0.05, **p<0.01, ***p<0.001 (E, F). In E and F individual experimental replicates are shown along with the mean and SEM.
Figure 3—figure supplement 1—source data 1. Quantification of nuclear staining intensity and GFP-positive neurons Figure 3—figure supplement 1.