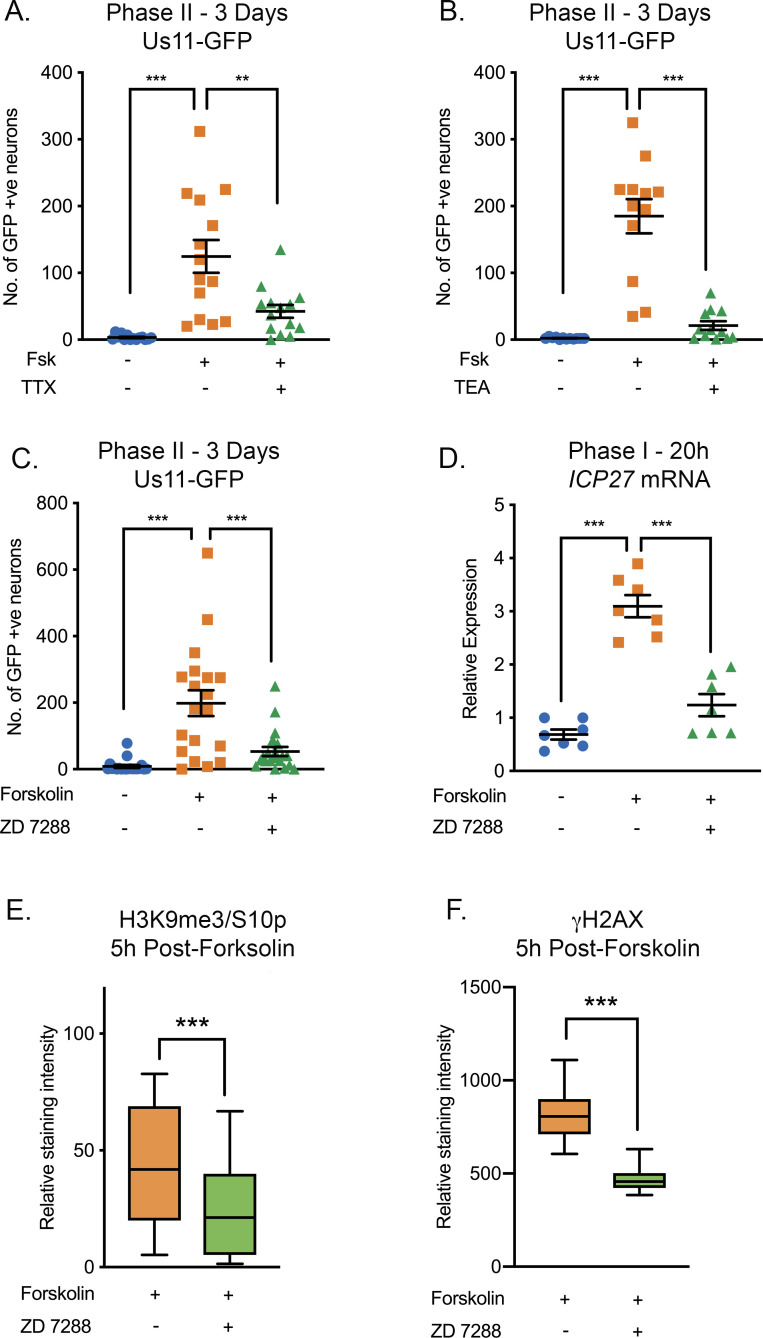
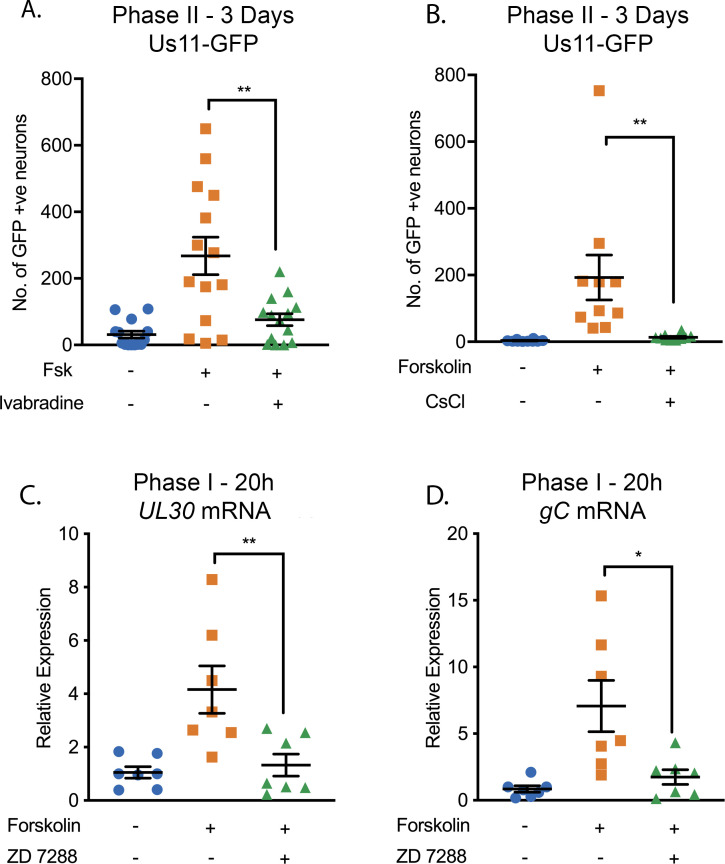
Figure 4. HSV Reactivation Mediated by Forskolin Requires Neuronal Excitability.
(A) Latently infected cultures were reactivated with forskolin in the presence of the voltage-gated sodium channel blocker tetrodotoxin (TTX; 1 µM) and the number of Us11-GFP-positive neurons quantified at 3 days post-reactivation. (B) Latently infected cultures were reactivated with forskolin in the presence of the voltage-gated potassium channel blocker tetraethylammonium (TEA; 10 mM) and the number of Us11-GFP-positive neurons quantified at 3 days post-reactivation. (C) Forskolin-mediated reactivation in the presence of the HCN channel blockers ZD 7288 (10μM) quantified as the numbers of Us11-GFP-positive neurons at 3 days post-reactivation. (D) The effect of ZD 7288 on the HSV lytic gene transcript ICP27 during Phase I reactivation measured at 20 hr post-forskolin treatment by RT-qPCR. In A-D individual experimental replicates are represented along with the mean and SEM. (E and F) Quantification of the relative nuclear staining for H3K9me3/S10p and γH2AX in SCG neurons at 5 hr post-forskolin treatment and in the presence of ZD 7288 from >800 cells/condition from two independent experiments. Data are plotted around the mean, with the boxes representing the 25th-75th percentiles and the whiskers the 5st-95th percentiles. Statistical comparisons were made using a one-way ANOVA with a Tukey’s multiple comparison (A–D) or two-tailed unpaired t-test (E–F). *p<0.05, **p<0.01, ***p<0.001. In A-D individual experimental replicates are represented.


