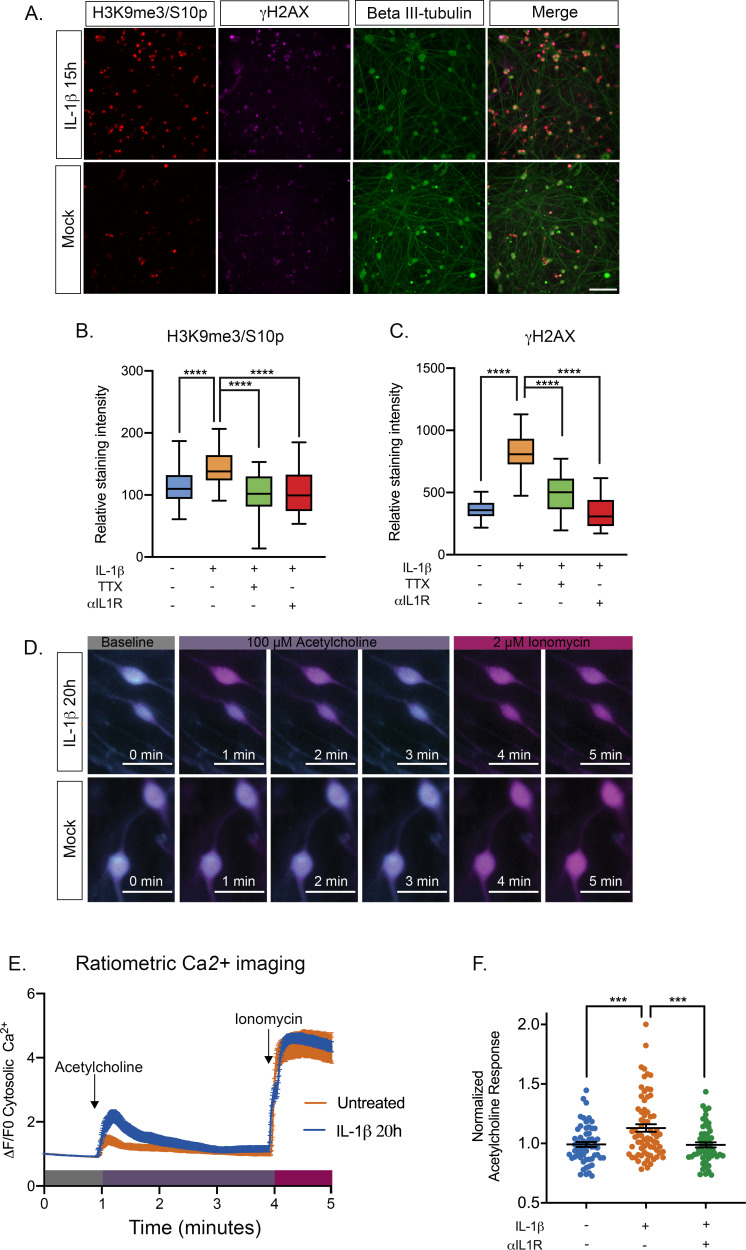
Figure 6. IL-1β Treatment of sympathetic neurons results in changes consistent with heightened neuronal excitability.
(A) Adult P36 SCG neurons were treated with IL-1β (30 ng/mL) for 15 hr and stained for H3K9me3/S10p, γH2AX and beta II-tubulin to mark neurons. (B and C) Quantification of the intensity of H3K9me3/S10p (B) and γH2AX (C) staining following 15 of IL-1β treatment and in the presence of tetrodotoxin (TTX; 1 μM) or anti-IL1 receptor (IL-1R) blocking antibody (2 μg/mL). Data are plotted around the median and whiskers represent the 5th-95th percentiles. (D) Representative images of cytosolic Ca2+ elevations measured using Fura-2-AM in neurons stimulated with 100 µM acetylcholine either pre-treated with IL-1β for 20 hr or mock treated. As a control the neurons were also treated with Ionomycin at the end of the protocol. Bar = 100 μm. (E) Representative experiment for cytosolic Ca2+ elevations in neurons stimulated with 100 µM acetylcholine. Cells were pretreated with IL-1β or vehicle for 20 hr prior to imaging. The plotted values were calculated as a change in fluorescence/initial fluorescence (ΔF/F0). Error bars represent SEM (IL-1β treatment, n = 58 cells and vehicle control, n = 25 cells). (F) Peak cytosolic Ca2+ elevations normalized to untreated controls in neurons stimulated with 100 µM acetylcholine. Cells were pretreated with IL-1β (n = 70, wells) or vehicle (n = 58, wells) for 20 hr prior to imaging. IL-1R blocking antibody (n = 54, wells) was also added. Data points represent individual wells, horizontal line represents mean. Statistical comparisons were made using a one-way ANOVA with a Tukey’s multiple comparison (B–D). ***p<0.001 ****p<0.0001.


