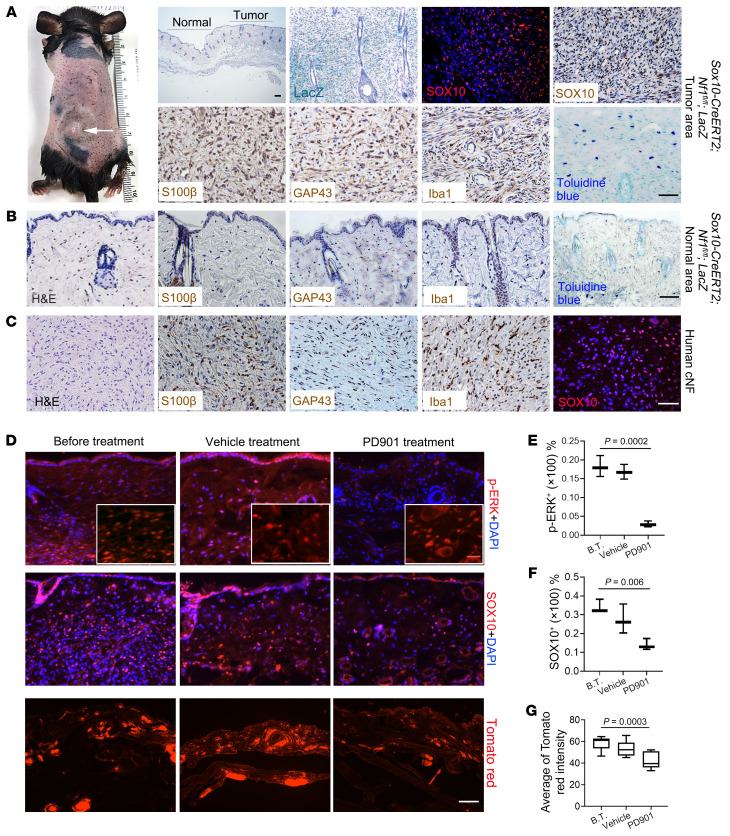
Figure 8. SOX10-expressing cells contain proliferating tumorigenic cells for cNF.
(A) Sox10-CreERT2 Nf1fl/fl mice gradually developed discrete cNFs (white arrow), characterized by increased skin thickness, positive staining for SOX10, S100β, GAP43, and Iba1, with mast cell infiltration. (B) The area distant from the tumor sites of discrete cNFs was characterized by S100β, GAP43, and Iba1 expression and toluidine blue staining. (C) Tissue from a patient with cNF was positive for S100β, GAP43, Iba1, and SOX10. n = 38. (D) Cutaneous NF tumors from Sox10-CreERT2 Nf1fl/fl R26-tdTomato mice before MEK inhibitor treatment (B.T.), after treatment with vehicle, and after treatment with the MEK inhibitor PD901 were harvested and stained for p-ERK, t-ERK (insets), and SOX10. n = 3 per treatment group. (E) Quantification of p-ERK+ cells. Comparisons among groups were performed by 1-way ANOVA. (F) Quantification of SOX10+ cells. Comparisons among groups were performed by 1-way ANOVA. (G) Quantification of tdTomato red intensity. n = 7–9/group. Comparisons among groups were performed by 1-way ANOVA. For the box-and-whisker plots in E, F, and G, the plots show the median (line) and lower and upper quartiles (box), and the ends of the whiskers represent the lowest and highest values. Scale bars: 50 μm and 25 μm (insets in D).

