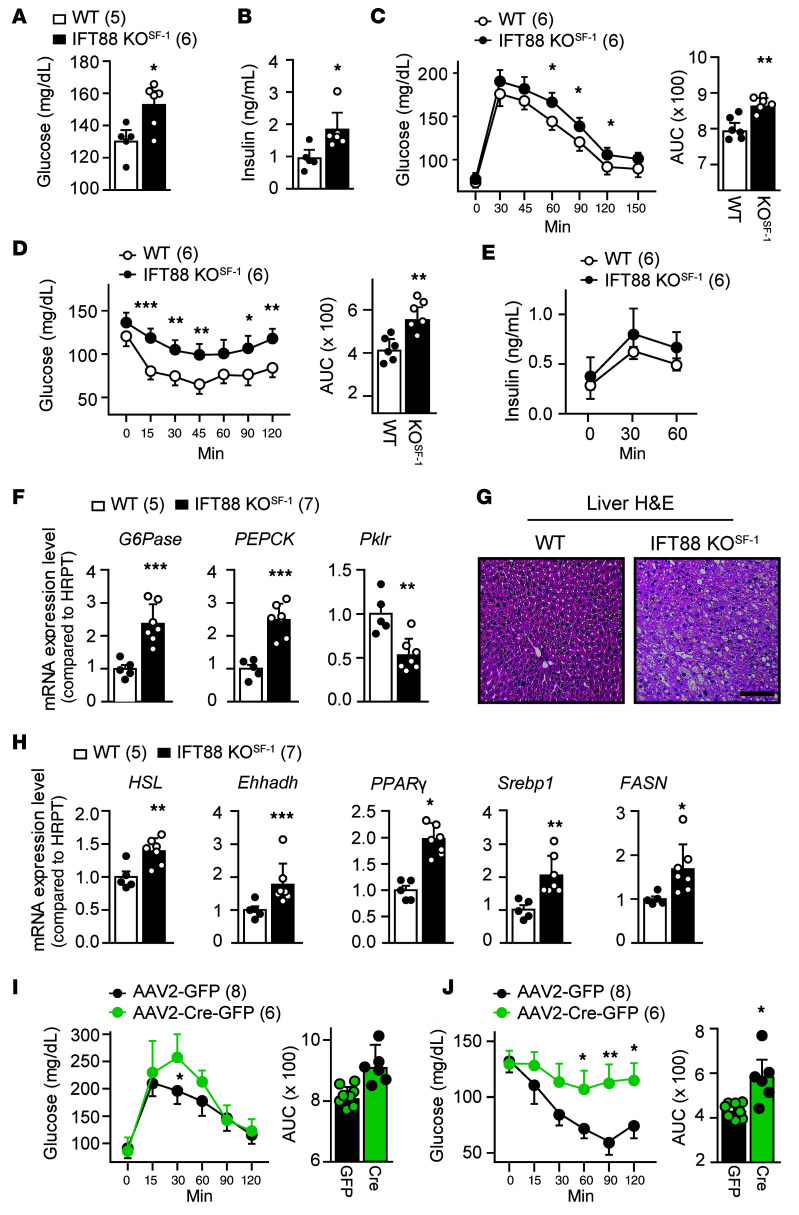
Figure 4. Impaired VMH-primary cilia result in glucose and insulin intolerance.
(A and B) Blood glucose (A) and insulin (B) levels in WT and IFT88-KOSF-1 littermates at 12 week of age. *P < 0.05, Student’s t test. (C) Left: GTT between WT and IFT88-KOSF-1. Right: AUC from GTT. *P < 0.05; **P < 0.01, 2-way ANOVA. (D) Left: ITT in indicated genotypes. Right: AUC for the ITT. *P < 0.05; **P < 0.01; ***P < 0.001, 2-way ANOVA. (E) Glucose-stimulated insulin secretion (GSIS) during GTT experiments. (F) Relative expression of gluconeogenic genes in the liver. **P < 0.01; ***P < 0.001, Student’s t test. (G) H&E staining of liver from WT and IFT88-KOSF-1 mice. Scale bar: 50μm. (H) Relative expression of lipogenesis-related genes in the liver. *P < 0.05; **P < 0.01; ***P < 0.001, Student’s t test. (I) GTT (left) and its AUC (right) in viral-mediated VMH-specific IFT88 KD models. *P < 0.05, 2-way ANOVA. (J) ITT (left) and its AUC (right) in viral-mediated VMH-specific IFT88 KD models. *P < 0.05; **P < 0.01, 2-way ANOVA. Number of animals examined is expressed parentheses in each graph. Data are expressed as mean ± SD.

