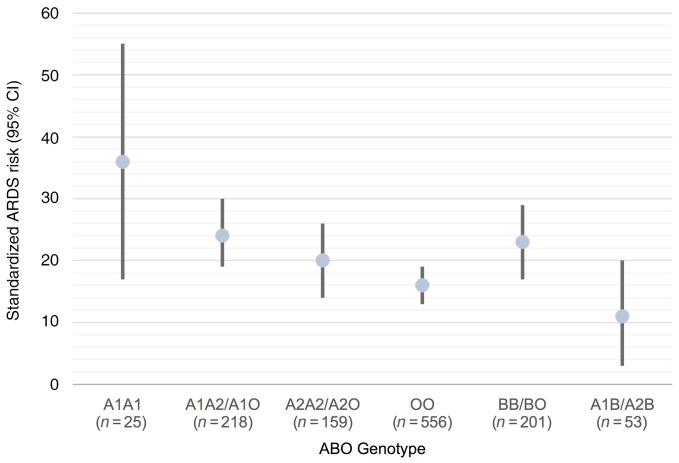
Figure 2. Standardized risk of moderate or severe ARDS by ABO genotype grouped by expected expression of A and B antigens in the PETROS trauma cohort.
The dot represents the standardized ARDS risk adjusted for injury severity score, age, sex, mechanism of trauma, and population stratification. The bars represent the 95% CI around the standardized risk. ARDS risk decreases when comparing ABO genotypes predicted to confer a higher density of A antigens (i.e., A1A1 has the highest A antigen density and ARDS risk, then A1A2/A1O, followed by A2A2/A2O, and finally OO).

