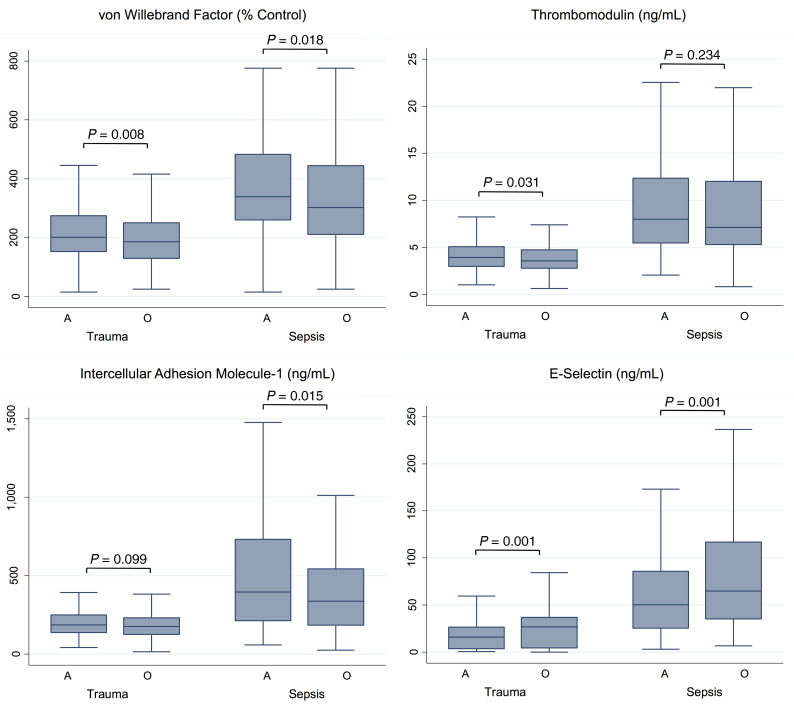
Figure 5. Box-and-whisker plots comparing the median concentrations of vWF, sTM, sICAM-1, and sE-selectin of ABO blood type A to O separately in trauma and sepsis.
The box-and-whisker plots display the median value as a line within the boxes, the bounds of the box representing the IQR, and the whiskers representing the range of the data. P values are for the unadjusted comparison of ABO blood type A to O using the Wilcoxon rank-sum test. Blood type A and O sample sizes for each biomarker are vWF: 450 trauma, 465 sepsis; sTM: 451 trauma, 465 sepsis; sICAM-1: 449 trauma, 454 sepsis; sE-selectin: 451 trauma, 453 sepsis.

