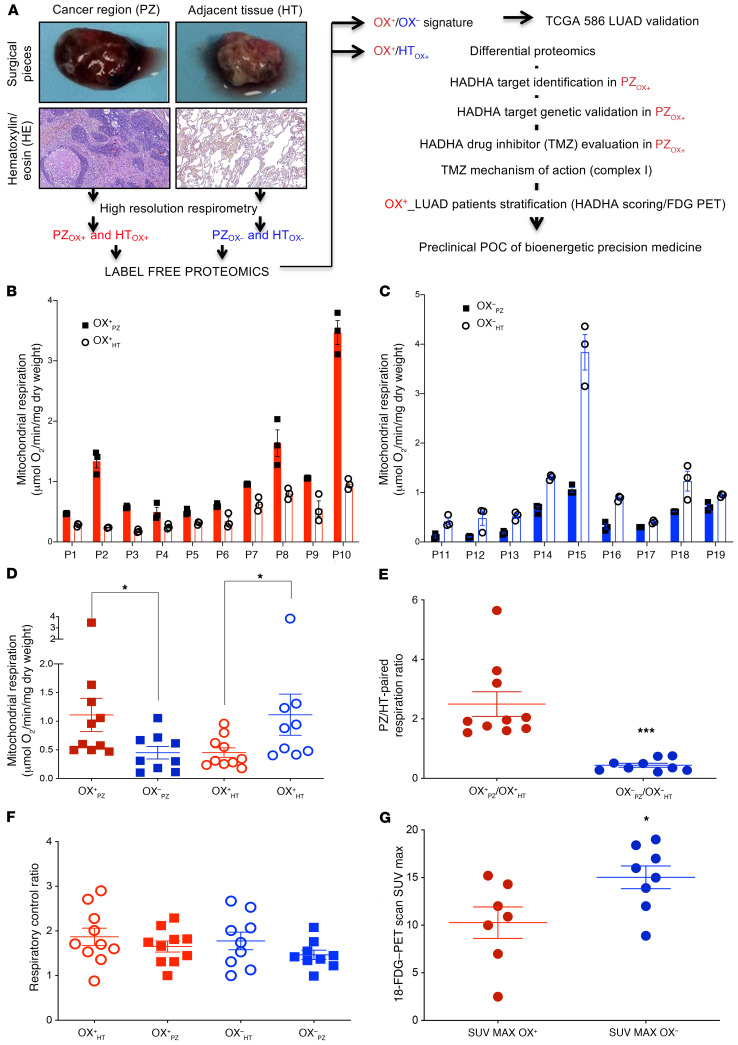
Figure 1. Oxidative human lung tumor (OX+ LUAD) identification by high-resolution respirometry.
(A) Tissue sampling and study workflow. The cancer region (PZ; proliferating zone) and the paired, cancer-adjacent tissue (HT; healthy tissue) were dissected by the pathologist and used for subsequent bioenergetic, proteomic, and immunohistology analyses. (B) Tissue respiration (PZ: plain bars and HT: empty bars) identified consistent bioenergetic mispairing between PZ and HT in the 2 groups of tumors: OX+ (PZOX+ > HTOX+; red) and (C) OX– (PZOX– < HTOX–; blue). (D) Comparison of the respiration of the OX+ LUAD group (red circles) versus the OX– LUAD (blue squares), for PZ (plain symbols) and HT (empty symbols), respectively. (E) PZ respiration normalized to HT respiration stratified the OX+ LUAD (red circles) and the OX– LUAD (blue squares) subgroups. (F) Respiratory control ratio (routine/oligomycin treated–respiration). (G) Glucose incorporation in the 2 subgroups of lung tumors as measured by the [18F]-FDG–PET scan. Differences between the OX+ and the OX– LUAD subgroups were compared using a 2-sided Student’s t test. Data are expressed as mean ± SEM. *P < 0.05, ***P < 0.001.

