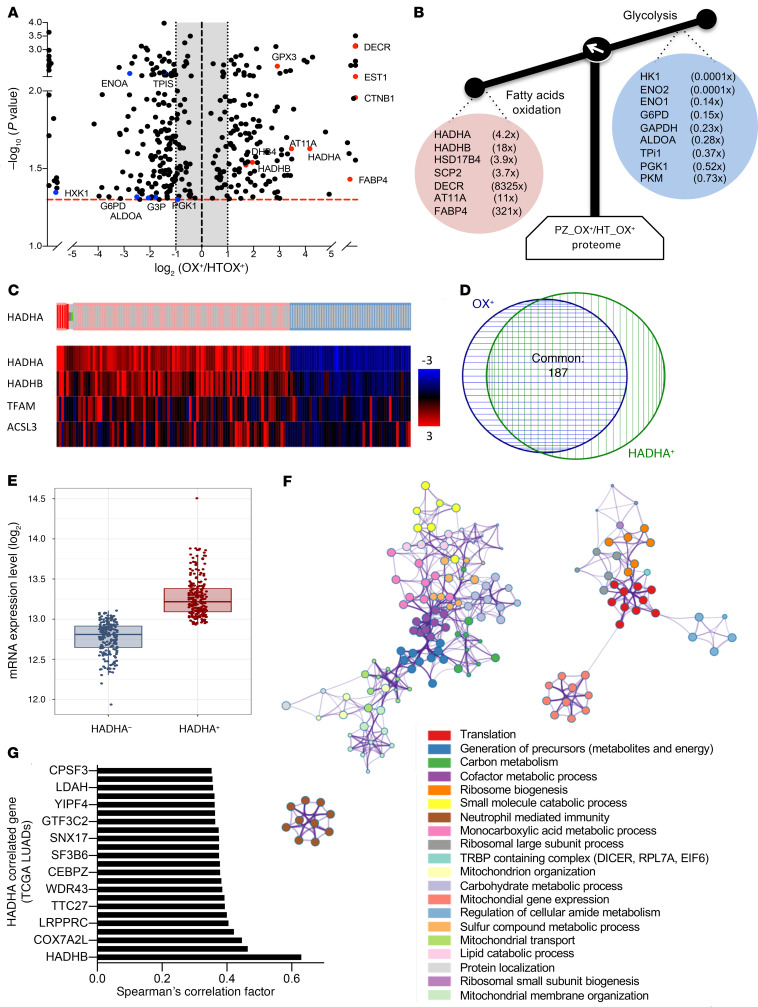
Figure 2. The MTP subunit HADHA is a priority target in OX+ LUAD.
(A) Volcano plot of the differential label-free proteomic analysis performed between PZOX+ and HTOX+ LUADs. (B) Proteins involved in glycolysis were repressed in PZOX+, whereas proteins involved in FAO were upregulated. The mean fold change ratio between OX+ PZ and OX+ HT is indicated. (C) Analysis of HADHA expression in 586 human LUAD samples (https://www.cbioportal.org/). Tumors with a positive HADHA z score higher than 1.2 (HADHA+) are indicated in red; tumors with HADHA z score less than 0.8 (HADHA–) are shown in blue. The heatmap gives the z score for the genes listed on the left. (D) Venn diagram showing the overlap between the TCGA LUAD OX+ tumors and the TCGA LUAD HADHA+ tumors identified in panel C. (E) HADHA absolute mRNA expression in HADHA+ and HADHA– LUAD tumors. (F) RNA-Seq data from the HADHA+ and the HADHA– LUADs were analyzed using DESeq2 to generate the list of genes that differed between the 2 groups (adjusted P < 0.005). This list was further analyzed using Metascape (metascape.org) to identify all statistically enriched GO/KEGG terms. The significant terms were then hierarchically clustered into a tree and converted into a network layout. Each term is represented by a circle node, where its size is proportional to the number of genes, and its color represents its cluster. Terms with a similarity score higher than 0.3 are linked by an edge (the thickness represents the similarity score) and visualized with Cytoscape (v3.1.2). One term from each cluster was selected as label. (G) Genes coexpressed with HADHA in TCGA lung tumors. The top genes with a Pearson coefficient higher than 0.35 are shown in the bar graph. Data are expressed as mean ± SEM.

