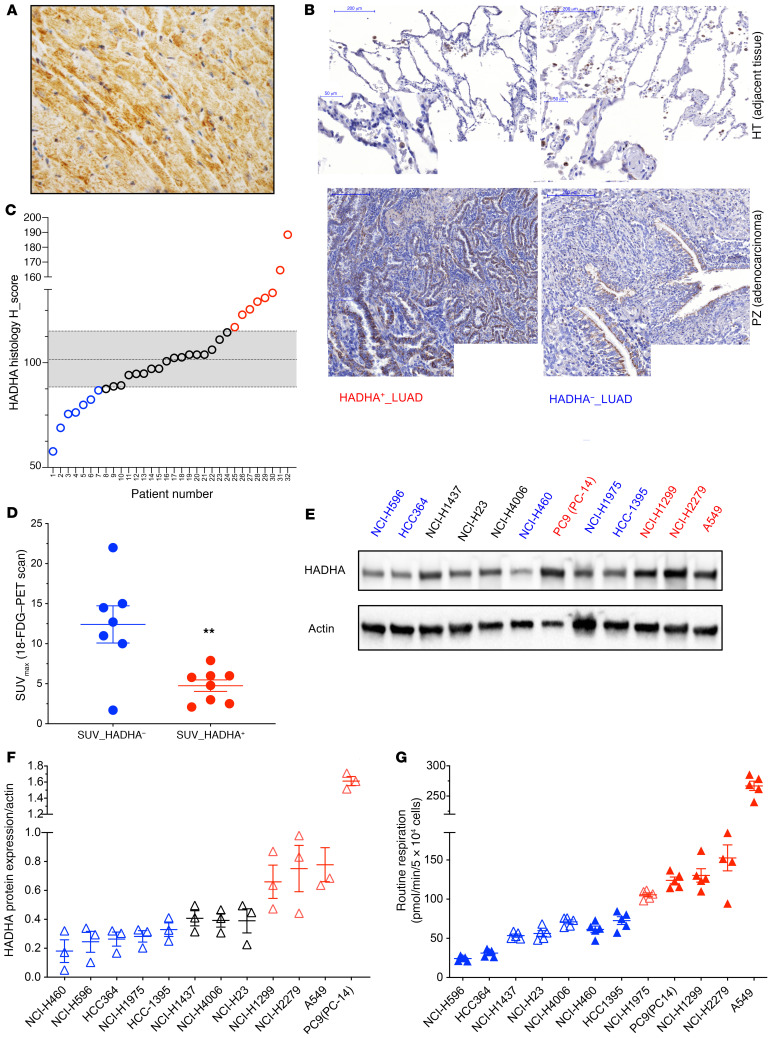
Figure 3. HADHA+ LUAD tumor and cell line stratification.
(A) HADHA immunohistology staining in mouse heart (40× zoom). A strong HADHA cytosolic staining (brown) can be observed in the myofibers (nuclei were stained in blue). (B) This method was applied to study HADHA expression in paraffin-embedded sections of lung tumors stained with hematoxylin (blue), eosin (red), and with a monoclonal antibody recognizing HADHA (brown staining). Representative tumors with either high HADHA expression (HADHA+ LUAD; left panel) or low HADHA expression (HADHA– LUAD; right panel) are shown. (C) HADHA tissue expression in the tumor and the noncancer tissue was used to calculate the HADHA histology score in 32 tumor samples. Tumors with HADHA score greater than median absolute deviation (MAD) were denominated HADHA+ LUADs (shown in red) and tumors with HADHA score less than MAD were denoted HADHA– LUADs (shown in blue). (D) Distribution of the [18F]-FDG–PET scan SUVmax values. (E) HADHA expression was determined by Western blot on a panel of 12 human lung cancer cell lines. (F) HADHA expression normalized to actin levels (mean expression value at dashed line) was used to segregate the cell lines with high (HADHA+; red) or low HADHA expression (HADHA–; blue). Cells with a black symbol show no difference to the median value. (G) Mitochondrial respiration was measured in the 12 human lung cancer cell lines using the Seahorse extracellular flux analyzer. The mean (dashed line) was used to segregate the cell lines with high (red) or low (blue) respiration. Cells with a plain symbol correspond to the HADHA–/OX– group (plain blue) or to the HADHA+/OX+ group (plain red). Data are expressed as mean ± SEM. **P < 0.01.

