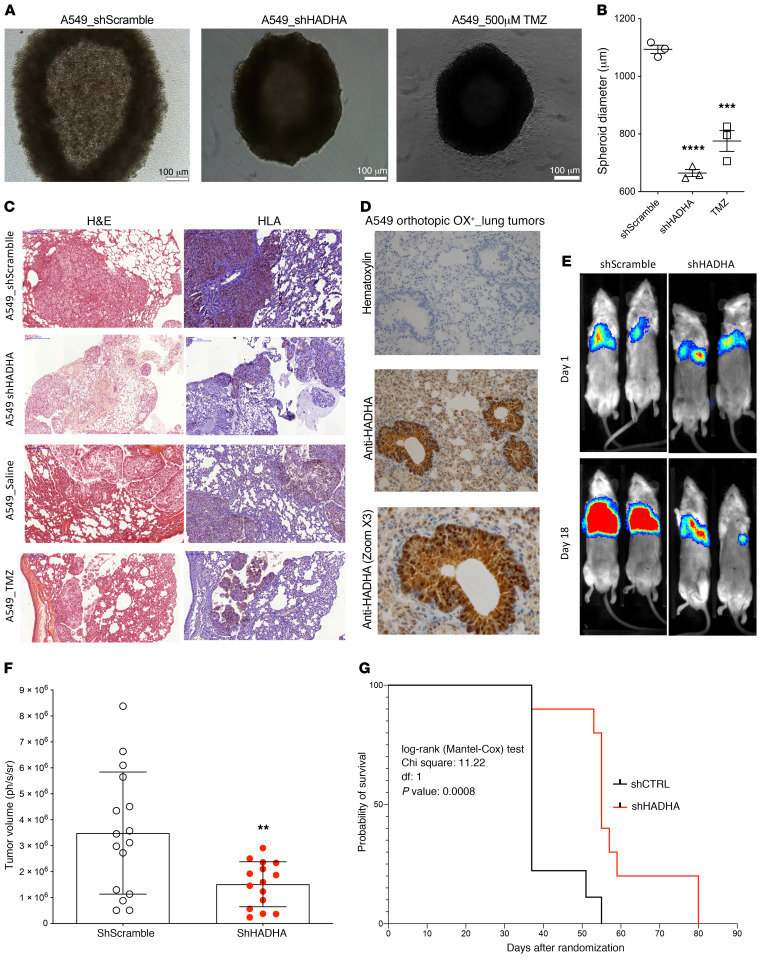
Figure 5. Anticancer effect of HADHA genetic inhibition in OX+ LUAD.
(A) Reduction of OX+ LUAD spheroid growth using HADHA shRNA or 50 μM TMZ on A549 cells cultured in anchorage-independent conditions. (B) Effect of MTP inhibition on A549 OX+ LUAD spheroid diameter. (C) Representative (10×) fields of 2 separate areas of A549 OX+ tumors: H&E staining (left; pink) and anti-human marker HLA (right; blue) staining of A549 cells in excised orthotopic human A549-OX+ LUAD tumors in NSG mice. (D) Immunohistology staining of HADHA in excised orthotopic human A549-OX+ LUAD tumors in NSG mice. H&E staining 20× zoom. Anti-HADHA 40× zoom. (E) Representative evolution of the bioluminescence signal from day 1 to day 18 in 2 groups of NSG mice: (i) orthotopic model of A549 expressing luciferase, (ii) orthotopic model of A549 shHADHA expressing luciferase. (F) Relative tumor volume obtained from the luminescence signal in the groups of mice treated with shRNA scramble and shRNA HADHA (N = 20 animals per group). (G) Animal survival (Kaplan-Meier representation) in the 2 groups of mice treated with shRNA scramble and shRNA HADHA (N = 20 animals per group). Values represent mean ± SEM; N = 4–6 for the in vitro experiments; N = 8–20 for the in vivo experiments. One-way ANOVA with Dunnett’s correction was used to analyze the results of panels A and B. Two-sided unpaired Student’s t test was used to compare the groups of mice in panel F. Log-rank (Mantel-Cox) test was used to compare animal survival in panel G. **P < 0.01, ***P < 0.001, ****P < 0.0001.

