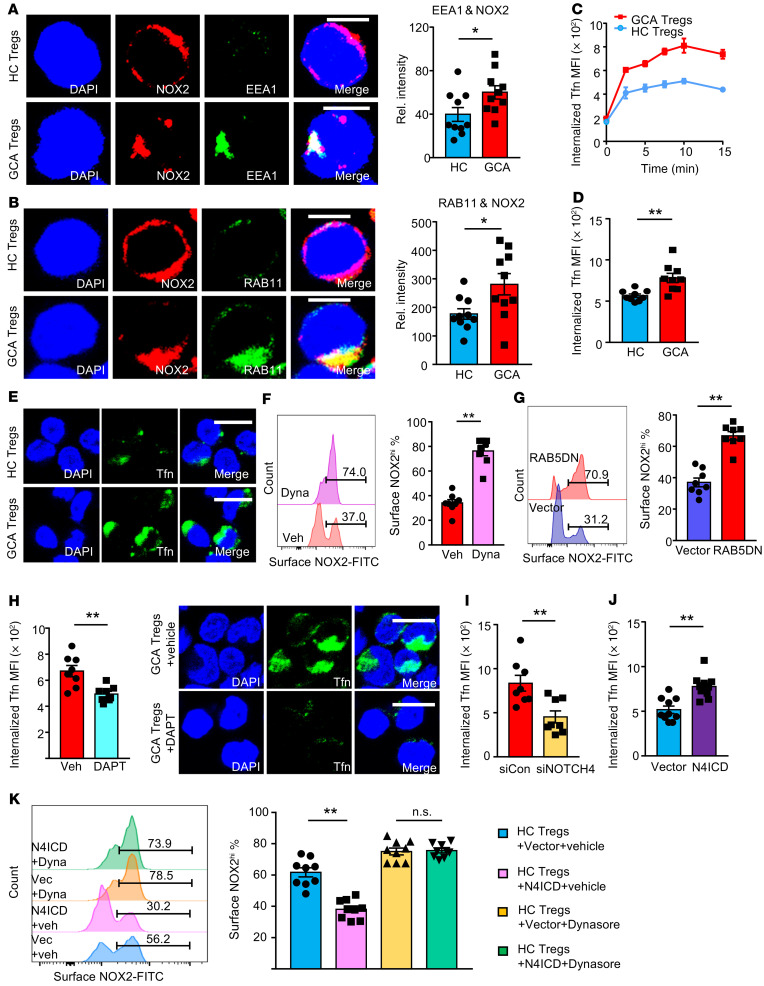
Figure 5. NOTCH4 signaling regulates the endocytic pathway.
(A) Confocal microscopy of CD8+ Tregs stained for the early endosome marker EEA1 (green), NOX2 (red), and DAPI (blue). Scale bars: 5 μm. Intensities of EEA1/NOX2 overlap for 10 cells in each group are shown. (B) Confocal microscopy of CD8+ Tregs stained for the recycling endosome marker RAB11 (green), NOX2 (red), and DAPI (blue). Scale bars: 5 μm. Intensities of RAB11/NOX2 overlap in 10 cells from each group are shown. (C and D) CD8+ Tregs were incubated with FITC-labeled transferrin (Tfn) for the indicated times. Internalized Tfn-FITC was determined by flow cytometry. Kinetic measurements (C) for 4 control and 4 GCA Tregs. Tfn uptake at 10 minutes (D) from 9 samples each. (E) CD8+ Tregs were incubated with Tfn-FITC and visualized by confocal microscopy (10 minutes). Scale bars: 10 μm. (F and G) GCA CD8+ Tregs were treated with the endocytosis inhibitor Dynasore (F) or transfected with a RAB5DN-containing or control vector (G). Cell surface NOX2 protein quantified by flow cytometry. Representative histograms and results from 8 patients each. (H) Tfn uptake was quantified in GCA CD8+ Tregs treated with DAPT/vehicle. Flow cytometry data (10 minutes) from 8 samples. Internalized Tfn was visible by confocal microscopy. Scale bars: 10 μm. (I) Tfn uptake was quantified in GCA CD8+ Tregs transfected with NOTCH4 or control siRNA. Flow cytometry data (10 minutes) from 8 patients. (J) Tfn uptake was quantified by FACS in healthy CD8+ Tregs transfected with a NOTCH4 ICD-containing or empty vector. Results from 10 samples. (K) HC CD8+ Tregs transfected with empty vector or NOTCH4 ICD-containing plasmid were treated with Dynasore or vehicle. Cell surface NOX2 protein was determined by flow cytometry. Representative histograms and results from 9 samples. CD8+ Treg cells were induced ex vivo. Data are mean ± SEM. *P < 0.05; **P < 0.01; ***P < 0.001 by unpaired Mann-Whitney-Wilcoxon rank test (A, B, and D), paired Mann-Whitney-Wilcoxon rank test (E–I), or 1-way ANOVA and post-ANOVA pairwise 2-group comparisons conducted with Tukey’s method (J).

