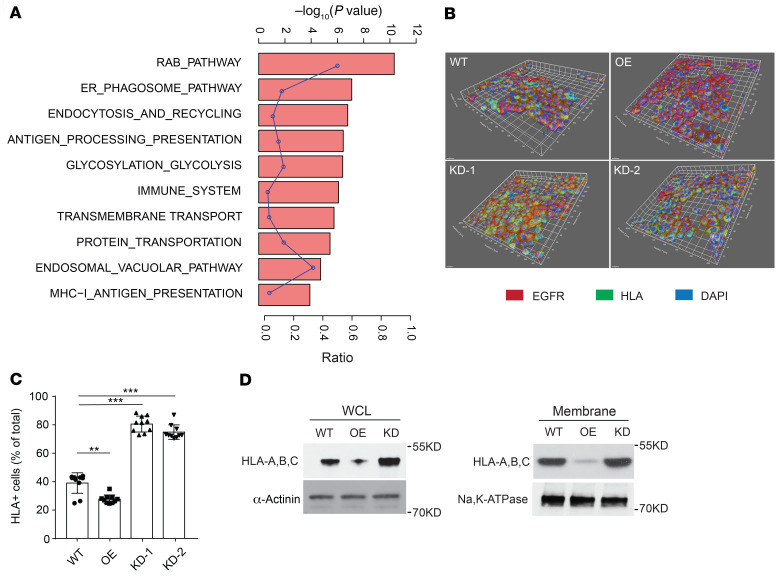
Figure 5. MAL2 suppresses the presentation of MHC-I molecules on breast cancer cell membrane.
(A) Mass spectrometry analysis showed that MAL2 was highly associated with MHC-I antigen presentation and endocytosis signaling. Gene Set Enrichment Analysis (GSEA) was performed to determine the signaling pathways. The curve shows enrichment ratios for the 10 top-ranked signaling pathways. Fisher’s exact test was used for statistical analysis. (B) Confocal 3D imaging of the MHC-I complex on the surface of MDA-MB-468 cells with different MAL2 levels. EGFR is a biomarker for cell surface proteins. (C) Quantitation results of confocal imaging analyses in B. One-way ANOVA test was used for statistical analysis. Data are presented as mean ± SD. *P < 0.05; **P < 0.01; ***P < 0.001. (D) Localization of human MHC-I proteins (HLA-A, B, C) in MDA-MB-468 cells was determined by immunoblotting analyses of cell fractions.

