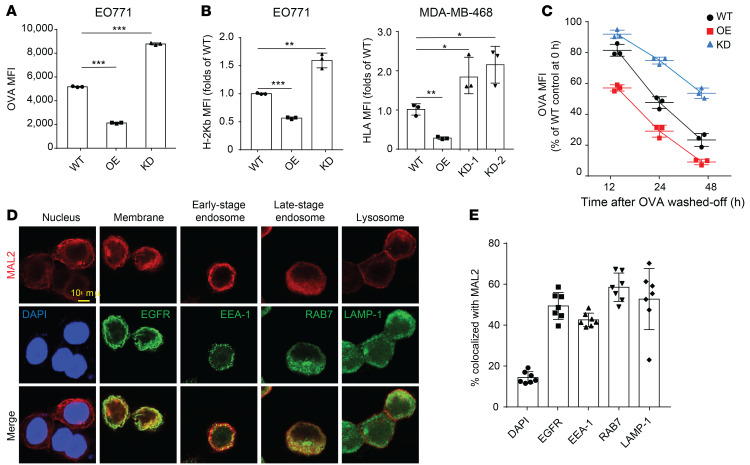
Figure 6. MAL2 downregulates antigen presentation on breast cancer cells.
(A) MAL2 downregulates antigen presentation on EO771-OVA cells with different MAL2 levels. The antigen presentation efficiency was assessed by flow cytometry. MFI scores are presented for 3 independent experiments. One-way ANOVA test was used for statistical analysis. (B) The presentation of the MHC-I complex on the cell membrane is inhibited by MAL2. EO771 and MDA-MB-468 cells with different MAL2 levels were tested. One-way ANOVA test was used for statistical analysis. (C) MAL2 promotes the turnover rate of tumor antigen on the cell surface. EO771 cells with different Mal2 expression levels were preincubated with OVA257-264 peptides and OVA257-264 peptides were washed off, and then cells were collected at indicated times and stained for the MHC-I–presented OVA257-264. Two-way ANOVA test was used for statistical analysis. (D) Localization of the MAL2 protein in MDA-MB-468 cells. EGFR is biomarker for membrane proteins. EEA-1 and RAB7 are biomarkers for early and late stage endosomes, respectively, and LAMP-1 is a biomarker for lysosomes. Scale bar: 10 μm. (E) Quantification of (D). In this figure, data are presented as mean ± SD. *P < 0.05; **P < 0.01; ***P < 0.001.

