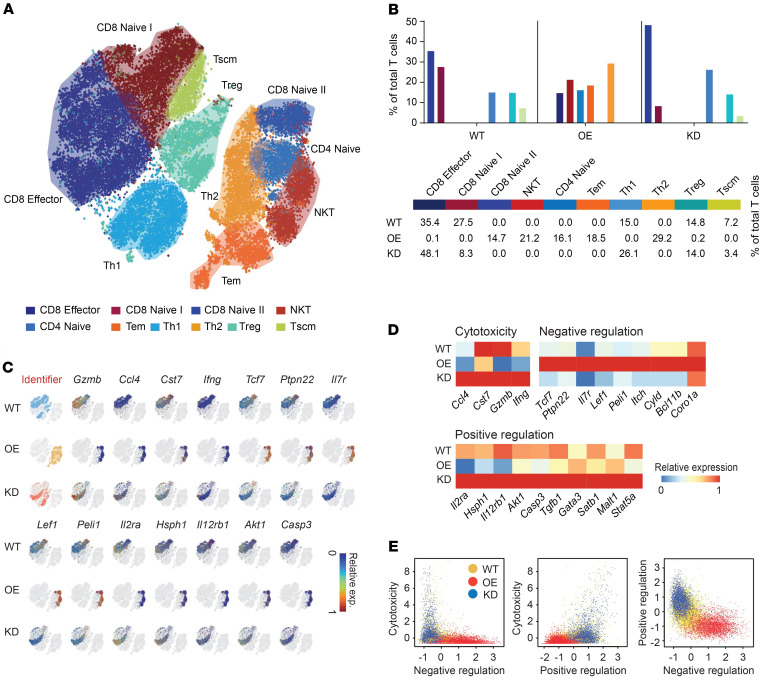
Figure 8. Mal2 expression levels are negatively correlated with tumor infiltration and cytotoxicity of CD8+ T cells in vivo revealed by scRNA-Seq analysis.
(A) A total of 27,827 CD3+ T cells were isolated from EO771 tumors with different Mal2 expression levels (WT, OE, and KD) and profiled with 10x Genomics. 10 groups are identified (by Louvain algorithm) and color marked over the t-SNE plot. (B) Distribution of T cell subtypes within EO771 tumors expressing different levels of Mal2 (WT, OE, and KD). (C) Functional marker gene expression of CD8+ T cells from the tumors expressing different levels of MAL2 over the low-dimensional t-SNE plot. (D) Relative gene expression heatmap of CD8+ T cells from the tumors expressing different levels of MAL2. Key genes responsible for cytotoxicity, negative regulation, and positive regulation of CD8+ T cells are shown. (E) The average expression levels of the T cell function genes in CD8+ T cells from the tumors expressing different levels of MAL2.

