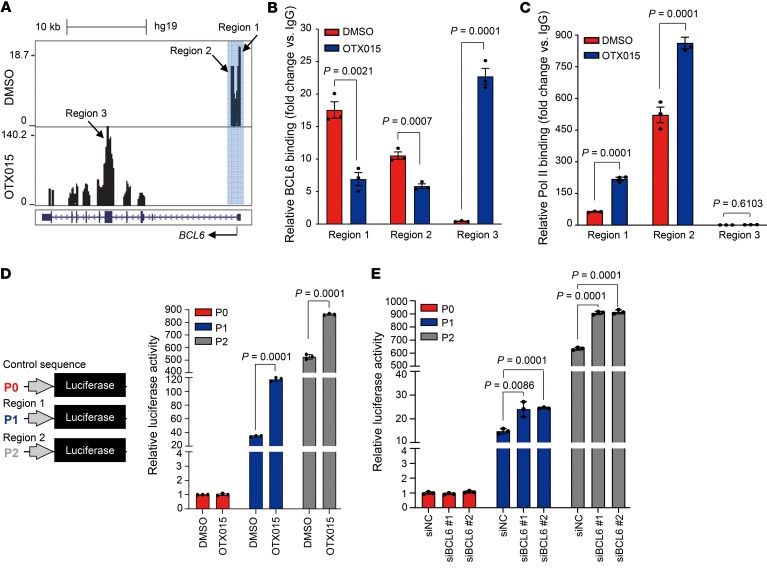
Figure 3. BET inhibition disrupts the BCL6 autoregulatory circuit.
(A) OTX015 treatment shifted BCL6 from binding its promoter regions (region 1 and region 2) to its coding region (region 3). A549 cells were treated with DMSO or OTX015 (300 nM) for 6 hours. Chromatin was sheared and subsequently precipitated using a specific antibody against BCL6. Cellular DNA for the ChIP assay was isolated and analyzed on an Illumina NextSeq 500 instrument. Reads were mapped to the human reference genome (GRCh37/hg19) using Bowtie2 (version 2.2.9). UCSC’s Genome Browser tracks showed BCL6 ChIP-Seq signals in the BCL6 gene locus. Blue shading marks the peaks located in the promoter region. (B) OTX015 treatment promoted BCL6 to bind to its coding region. qPCR was performed with primers specifically targeting region 1, region 2, and region 3 of the BCL6 gene. The data are plotted relative to the values obtained with the IgG control antibody. Data represent the mean ± SEM of biological triplicates. P values were analyzed by unpaired, 2-tailed Student’s t test, comparing the OTX015 treatment group with the control group. (C) RNA Pol II–binding level at the 3 indicated regions examined by ChIP-qPCR. Data represent the mean ± SEM of biological triplicates. P values were determined by unpaired, 2-tailed Student’s t test, comparing the OTX015 treatment group with the control group. (D) Response of different BCL6 promoter (P) regions to OTX015 treatment. Luciferase reporter vectors with promoters containing the indicated BCL6 promoter regions (region 1 and region 2) or the control sequence were equivalently transfected into A549 cells. Transfected cells were then exposed to 300 nM OTX015. Cells were harvested to detect luciferase expression 48 hours after transfection. Data represent the mean ± SD of biological triplicates. P values were determined by unpaired, 2-tailed Student’s t test, comparing the OTX015 treatment group with the control group. (E) Response of different BCL6 promoter regions to BCL6 silencing. Luciferase reporter vectors with promoters containing the indicated BCL6 promoter regions (mentioned in D) or the control sequence were equivalently transfected into BCL6-knockdown A549 cells. Transfected cells were harvested to detect luciferase expression 48 hours after transfection. Data represent the mean ± SD of biological triplicates. P values were determined by unpaired, 2-tailed Student’s t test, comparing the siBCL6 groups with the control group.

