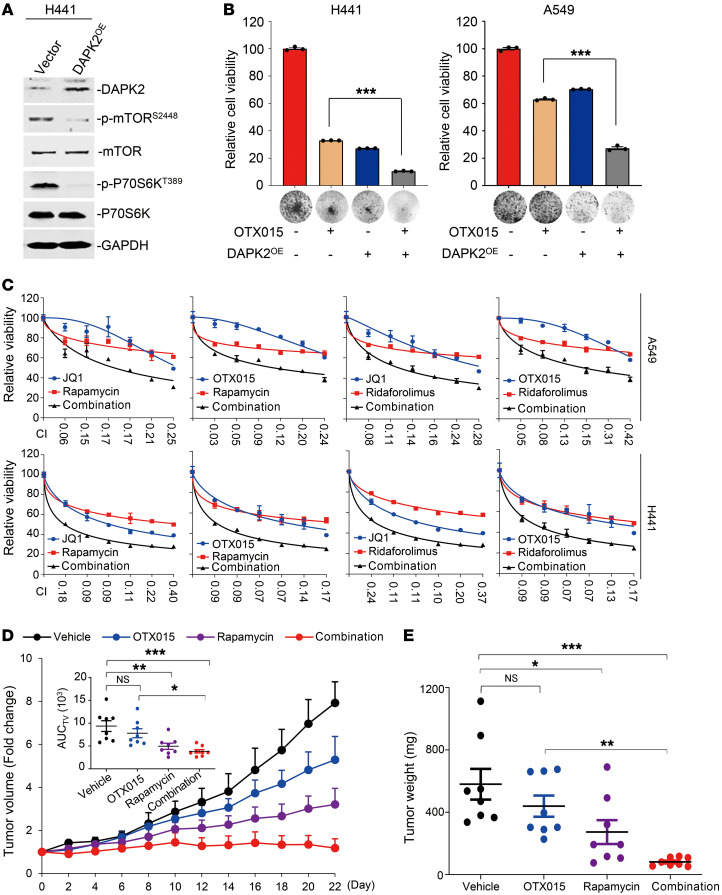
Figure 7. mTOR inhibition sensitizes KRAS-mutant NSCLC to BETi.
(A) DAPK2 overexpression suppressed mTOR and S6K phosphorylation. H441 cells infected with a pCDH-DAPK2 or pCDH control virus were subjected to immunoblot analysis. Immunoblots were contemporaneous and run in parallel from the same biological replicate, respectively. (B) Colony formation of H441 and A549 cells with DAPK2 overexpression. Results are representative of 3 independent experiments. Data represent the mean ± SEM of biological triplicates. ***P < 0.001, by unpaired, 2-tailed Student’s t test, comparing the DAPK2OE group with the vector group in the presence of OTX015. (C) Synergistic interaction between BETi (OTX015 and JQ1) and mTORi (rapamycin and ridaforolimus) in KRAS-mutant NSCLC cells. A549 and H441 cells were treated for 48 hours with various concentrations of the indicated inhibitors. The concentrations of BETi or mTORi were used in a 2-fold dilution series (0.78, 1.56, 3.13, 6.25, 12.5, and 25 μM for individual BETi; 0.78, 1.56, 3.13, 6.25, 12.5, and 25 nM for individual mTORi). Relative cell viability was subsequently measured. Data represent the mean ± SD of biological triplicates. CI values at each concentration were calculated using CalcuSyn software. (D) Tumor growth curves of LACPDX (n = 8 per group). The mean AUC of tumor volumes on day 23 is shown. Data represent the mean ± SEM. *P < 0.05, **P < 0.01, and ***P < 0.001, by 1-way ANOVA. (E) Tumor weights at the end of therapy. Each dot represents a tumor from an individual mouse. Data represent the mean ± SEM. *P < 0.05, **P < 0.01, and ***P < 0.001, by 1-way ANOVA.

