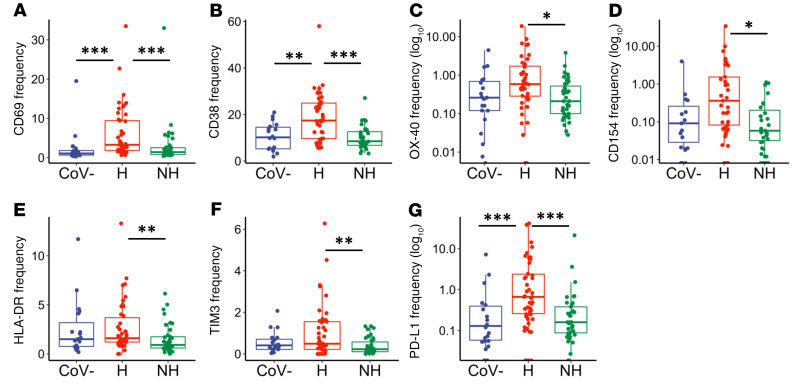
Figure 3. CD8+ T cell activation and exhaustion in hospitalized and nonhospitalized individuals.
Frequency of CD8+ T cells expressing a given activation or exhaustion marker. (A–G) Markers that were elevated in hospitalized over nonhospitalized individuals. Boxplots indicate median, IQR, and 95% confidence interval. P values determined by Wilcoxon’s rank-sum test. *P ≤ 0.05, **P ≤ 0.01, ***P ≤ 0.001. Healthy: CoV– (nCoV-= 20), hospitalized: H (nH= 46), nonhospitalized: NH (nNH= 39).

