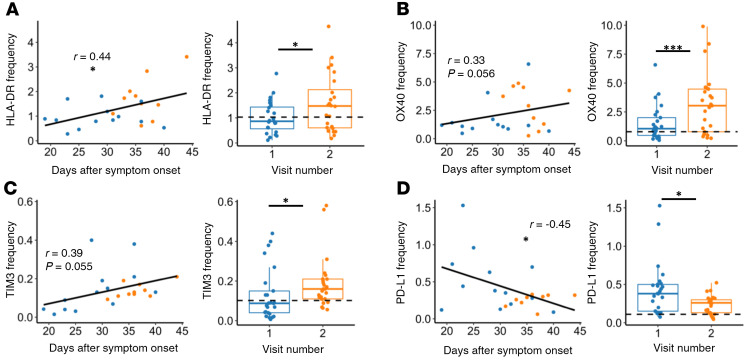
Figure 5. CD4+ T cell activation and exhaustion over time in nonhospitalized individuals.
(A–C) HLA-DR, OX40, and TIM3 frequencies increased over time, while (D) PD-L1 frequency decreased over time in nonhospitalized patients. Plots on left show days after symptom onset versus frequency (n = 23, P values determined by mixed-effects model and relationship represented by linear regression; blue: visit 1, orange: visit 2). Plots on right show paired analysis of first versus second visits (n = 25, P values determined by paired Wilcoxon’s signed-rank test). Dotted line shows median values of healthy samples as baseline. Boxplots indicate median, IQR, and 95% confidence interval. *P ≤ 0.05, ***P ≤ 0.001.

