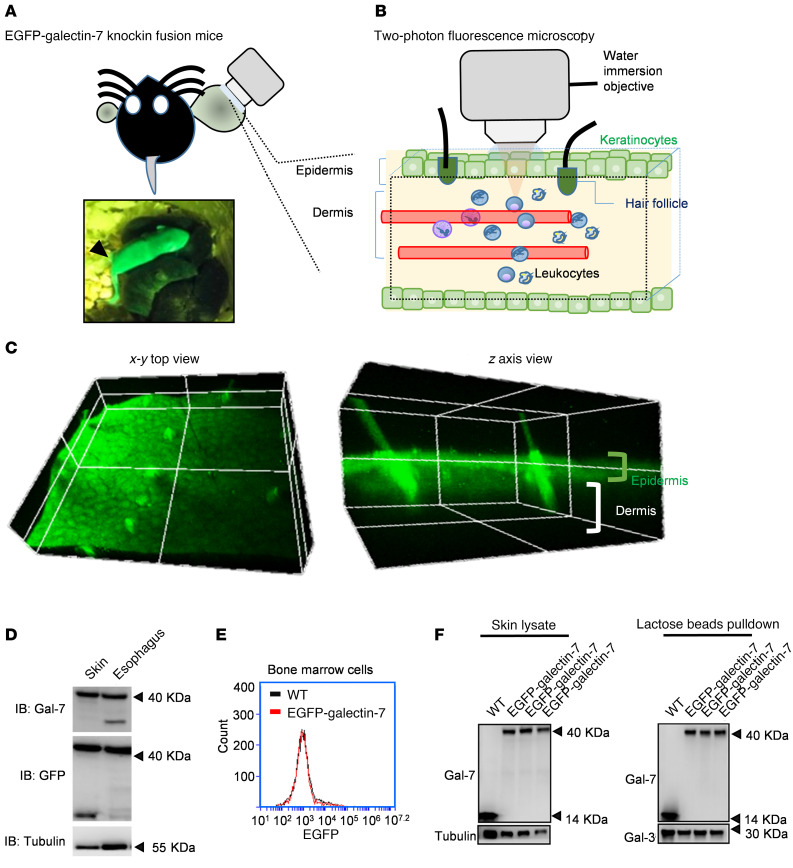
Figure 6. Two-photon deep-tissue visualization of EGFP–galectin-7 expression in transgenic mice.
(A) Detection of green fluorescent signal on the whole-body surface. (B) Schematic representation of the 2-photon image analysis of deep tissue in the ear. (C) Three-dimensional images of the view of x-y axis and z axis planes. (D) Immunoblot analysis of galectin-7–GFP expression from tissues of EGFP–galectin-7 transgenic mouse. (E) Flow cytometry analysis of bone marrow cells purified from WT and EGFP–galectin-7 transgenic mice. (F) Affinity purification of EGFP–galectin-7 fusion protein from the lysates of skin samples from EGFP–galectin-7 transgenic mice, followed by immunoblot analysis.

