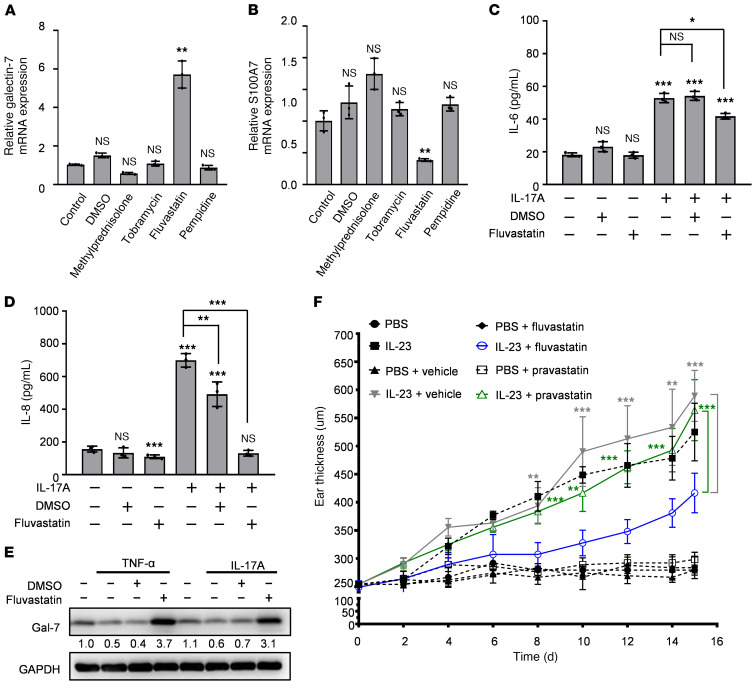
Figure 7. Fluvastatin increases galectin-7 levels in keratinocytes, suppresses production of proinflammatory cytokines, and attenuates IL-23–induced epidermal thickness.
(A and B) Real-time PCR analysis of the mRNA expression of galectin-7 and S100A7 in HaCaT cells treated with methylprednisolone (10.6 μM), tobramycin (8.6 μM), fluvastatin (9.2 μM), pempidine (13 μM), or vehicle control (DMSO) for 24 hours. The relative fold changes were calculated using the ΔΔCt method; data from all the samples were normalized to the control sample, and GAPDH served as an endogenous control. (C and D) Production of IL-6 and IL-8 by HaCaT cells treated for 2 days with fluvastatin with or without IL-17A (200 ng/mL) was measured by ELISA. For statistical analysis, each group was compared with control group (first bar: group without IL-17A, DMSO, and fluvastatin). (E) Immunoblotting analysis of galectin-7 in keratinocytes treated with TNF-α or IL-17A with or without fluvastatin or DMSO. (F) Ear thicknesses of different groups — PBS (n = 3), IL-23 (n = 3), PBS + vehicle (n = 5), IL-23 + vehicle (n = 5), PBS + fluvastatin (n = 3), IL-23 + fluvastatin (n = 5), PBS + pravastatin (n = 4), IL-23 + pravastatin (n = 5) — of mice subjected to intradermal injections of IL-23 or PBS, as described in Figure 5, and treated with fluvastatin (blue line), pravastatin (green line), or saline. For statistical analysis, either 1-way (A and B) or 2-way (C, D, and F) ANOVA with Tukey’s multiple-comparison test was used. Three independent biological replicates were performed for real-time PCR and ELISA analyses. The results (adjusted P values) of group pairs are annotated on the graph (IL-23 + fluvastatin group vs. corresponding IL-23 + vehicle group indicated in gray; IL-23 + fluvastatin group vs. corresponding IL-23 + pravastatin group indicated in green). *P < 0.05, **P < 0.01, ***P < 0.001.

