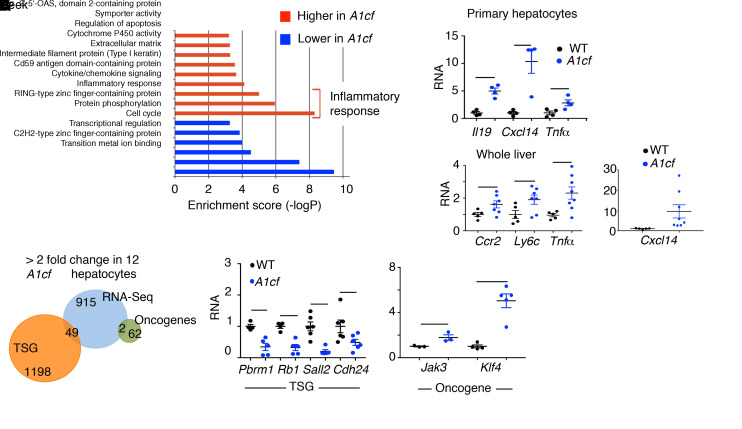
Figure 11. A1cf+/Tg primary hepatocytes show enrichment in inflammatory response pathways.
(A) Gene Ontology analysis showing functional pathways overrepresented (red) and underrepresented (blue) in A1cf+/Tg hepatocytes. Relative expression of genes involved in inflammatory response examined by qPCR, in both isolated hepatocytes and whole liver (5–8 per genotype). Data are mean ± SEM, *P < 0.05, **P < 0.01 (unpaired t test). (B) Venn diagram representing comparative analysis between genes with differentially altered expression in A1cf+/Tg hepatocytes and Tumor Suppressor Gene (TSG) and Oncogene databases. qPCR validation of a subset of TSG and Oncogene RNAs from 4–5 independent hepatocyte isolations per genotype. Data are mean ± SEM, *P < 0.05, **P < 0.01 (unpaired t test).

