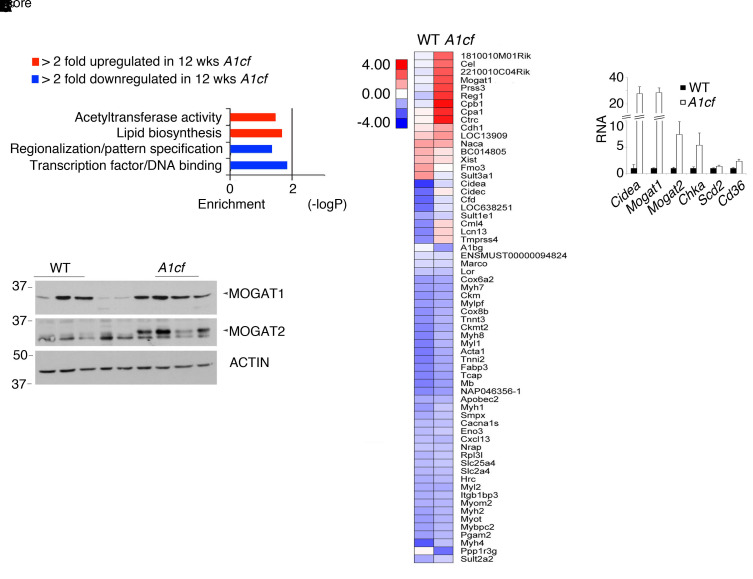
Figure 3. Hepatic enrichment in genes involved in lipid biosynthesis in A1cf+/Tg mice.
Expression profile of liver-enriched genes in 8- to 14-week-old chow-fed A1cf+/Tg mice. (A) Enriched KEGG pathways in differentially expressed genes from A1cf+/Tg livers. Heatmap diagram of the more than 2-fold differentially expressed genes in A1cf+/Tg mice. (B) qPCR validation of differentially upregulated genes involved in lipid biosynthesis (n = 6–7 mice per genotype). Data are mean ± SEM. Unpaired Student’s t test was used to determine significance between genotypes, *P < 0.05, **P < 0.01. (C) Western blot analysis of MOGAT1 and MOGAT2 in livers from chow-fed A1cf+/Tg mice. Actin was used as loading control. (n = 4–5 mice per genotype.)

