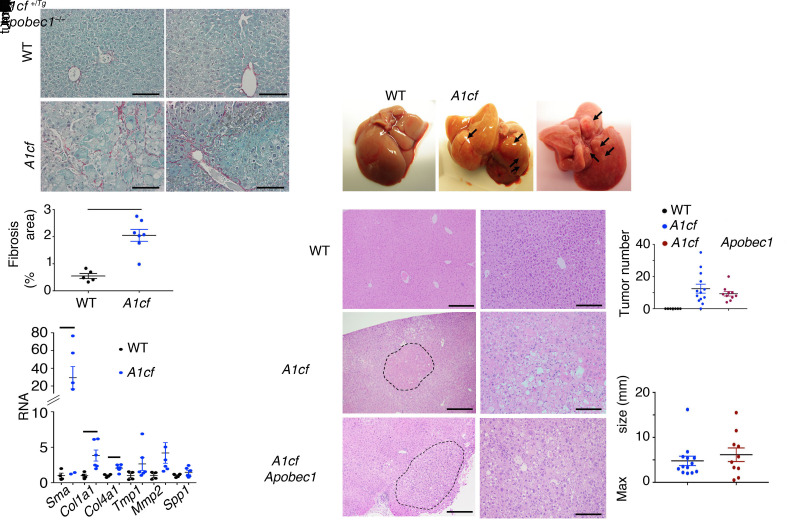
Figure 5. Hepatic overexpression of A1CF promotes fibrosis and spontaneous tumorigenesis.
(A) Representative images of Sirius red–stained A1cf+/Tg and WT livers. Scale bars: 50 μm. Quantitation of Sirius red–stained area expressed as percentage total area (mean ± SEM). Significance was determined using unpaired Student’s t test, **P < 0.01 (n = 6). Bottom panel: qPCR evaluation of fibrogenic genes in livers of chow-fed 12-month-old A1cf+/Tg mice. Data are mean ± SEM (n = 6 per genotype). Unpaired t test was used to determine significance between 12-month-old groups, *P < 0.05. (B) Gross images of liver from A1cf+/Tg and A1cf+/Tg Apobec1–/– mice at 12 months of age fed a low-fat chow diet. (C) Representative images of H&E-stained liver sections from A1cf+/Tg and A1cf+/Tg Apobec1–/– mice. The dashed curved lines delineate tumor margin. Scale bars: 100 μm (left) and 50 μm (right). Macroscopic quantitation and size of nodules showing total number (top) and maximum size (bottom) of tumors.

