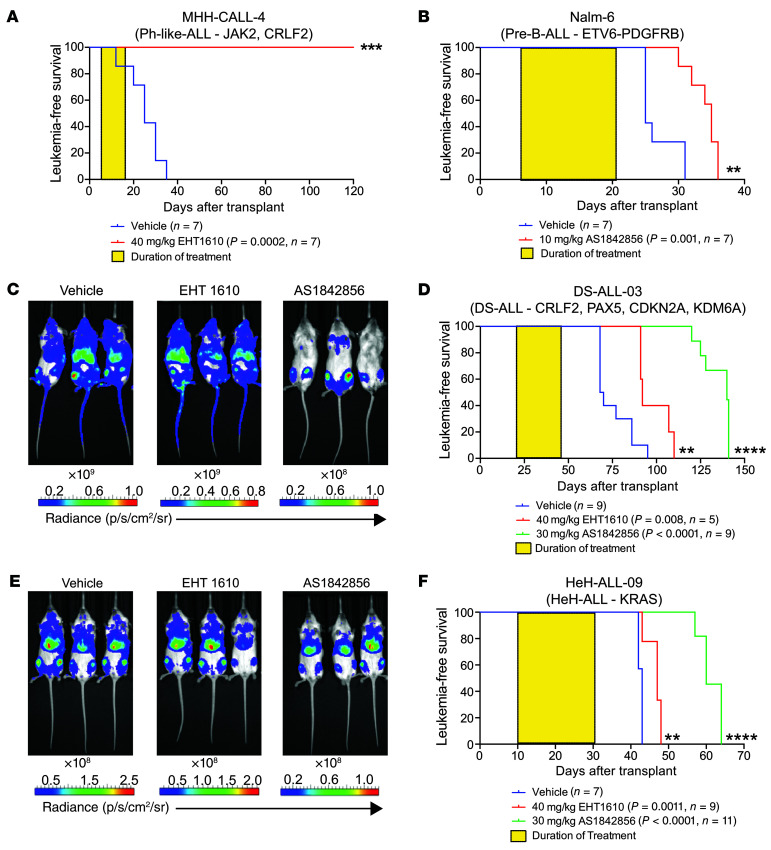
Figure 6. FOXO1 and DYRK1A are therapeutic targets in B-ALL.
(A and B) MHH-CALL-4 and Nalm-6 cell lines were transplanted into NSG mice, and the animals were treated with EHT 1610 or AS1842856, respectively, for 2 weeks (yellow boxes). Kaplan-Meier analysis of mice treated with EHT 1610 (A) or AS1842856 (B) was performed. Graph titles describe the genetic backgrounds of the transplanted leukemia cells. P values and sample sizes (n) are shown in the key. (C) NSG mice were transplanted with a DS-ALL-03 luciferase-expressing PDX sample and treated with EHT 1610 or AS1842856. Representative images of leukemic burden within each treatment cohort are shown. Radiance scales are shown below each image. (D) Kaplan-Meier analysis of DS-ALL-03 cohorts after 3 weeks (yellow box) of treatment. Graph title describes the genetic background of the leukemia. P values and sample sizes (n) are shown in the key. (E) NSG mice were transplanted with the HeH-ALL-09 luciferase-expressing PDX sample and treated with EHT 1610 or AS1842856. Representative images of leukemic burden within each treatment cohort at the treatment endpoint are shown. Radiance scales are shown below each image. (F) Kaplan-Meier analysis of HeH-ALL-09 cohorts after 3 weeks (yellow box) of treatment. Graph title describes the genetic background of the leukemia. P values and sample sizes (n) are shown in the key. Significance was determined by log-rank (Mantel-Cox) test (A, B, D, and F). **P < 0.01, ***P < 0.001, and ****P < 0.0001. sr, steradian.

