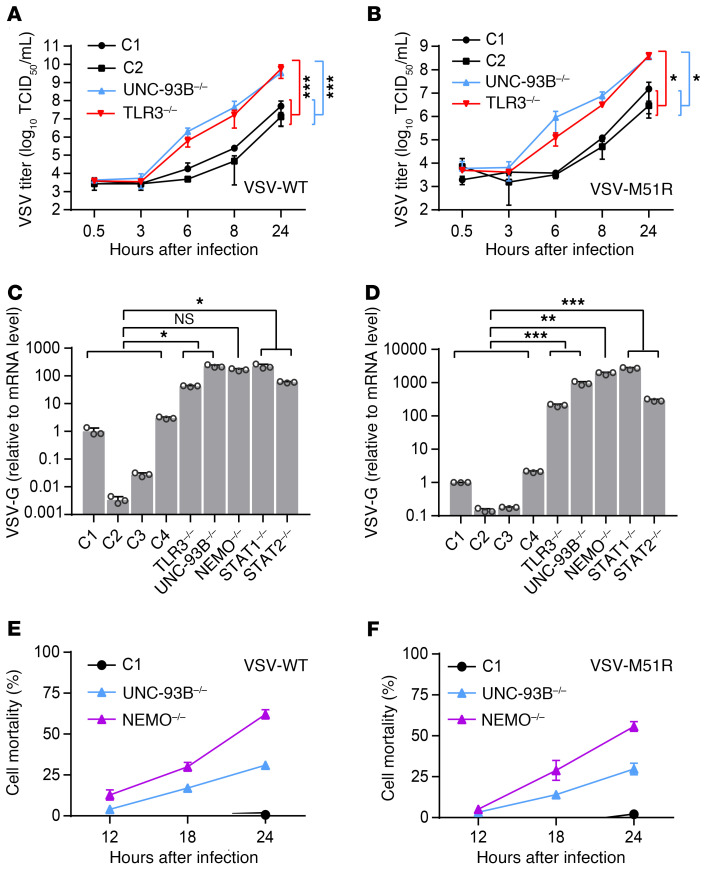
Figure 2. Unrestricted virus growth and cytotoxicity in fibroblasts with TLR3 signaling deficiencies.
VSV-WT (A) and VSV-M51R (B) single-cycle replication curves for fibroblasts from healthy controls (C1 and C2) and patients with UNC-93B or TLR3 deficiency at a MOI of 1 over 24 hours. Control fibroblasts (C1–C4) and TLR3–/–, UNC93B–/–, NEMO–/–, STAT1–/–, and STAT2–/– fibroblasts were infected with VSV-WT (C) and VSV-M51R (D) at a MOI of 0.01 for 16 hours. Viral VSV-G RNA levels were then determined by RT-qPCR and normalized against C1. Cell mortality following infection with VSV-WT (E) and VSV-M51R (F) at a MOI of 1 for C1, UNC-93B–/–, and NEMO–/– fibroblasts, as measured by the release of lactate dehydrogenase (LDH) at the times indicated, in hours postinfection (hpi). Values are expressed relative to those for uninfected cells. Triplicate measurements from 3 independent experiments (A–B, E–F) or representative results from 3 independent experiments (C–D) are shown. The error bars indicate SD of biological triplicates. P values were obtained through log transformation followed by 1-way ANOVA and subsequent Tukey’s multiple comparison tests (A–B) or likelihood ratio tests (C–D), by comparing each patient’s fibroblasts with control fibroblasts, and the respective P value is indicated. *P < 0.05, **P < 0.01, ***P < 0.001.

