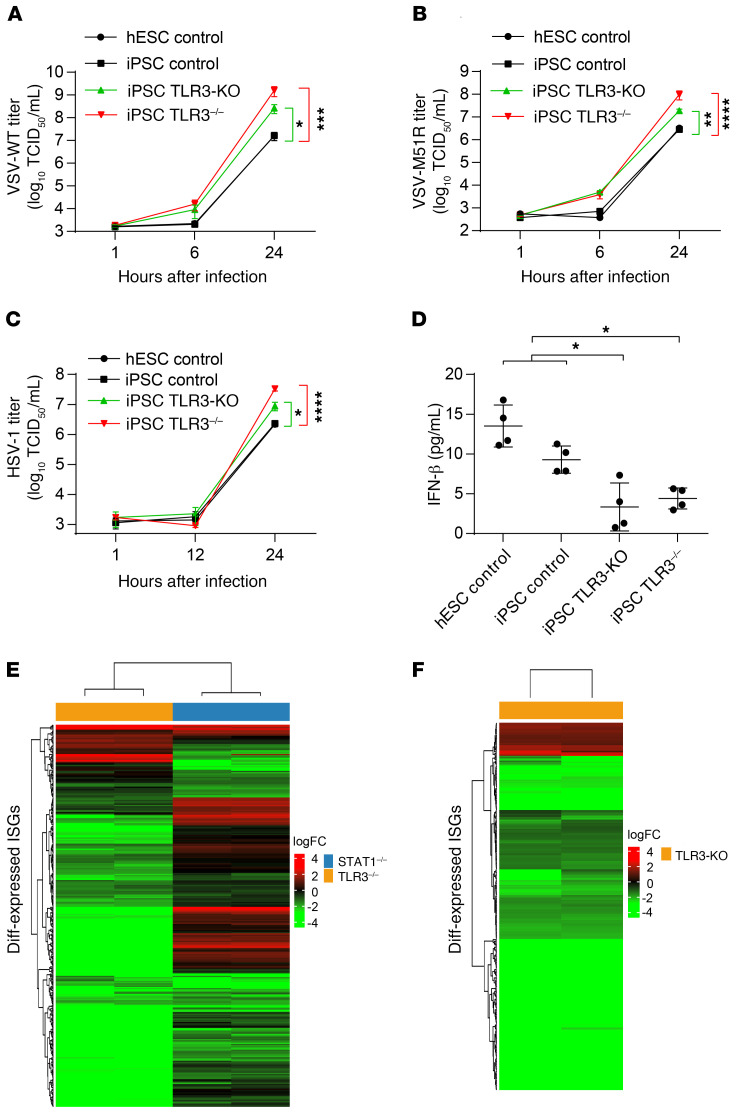
Figure 8. TLR3 controls basal IFN-β and antiviral immunity in cortical neurons.
HPSC-derived cortical neurons from 2 control lines (hESC control, iPSC control), a CRISPR/Cas9-mediated TLR3 knockout (TLR3-KO) line, and a TLR3–/– patient line were infected with VSV-WT (A), VSV-M51R (B), or HSV-1 (C) for the indicated times. Viral replication was assessed in 50% TCID50 assays. (D) IFN-β levels were measured in the culture supernatants of hPSC-derived cortical neurons, by Simoa digital ELISA. (E) Gene expression profile of the ISGs differentially expressed in patients with TLR3 (orange bar) and STAT1 (blue bar) deficiencies, relative to controls, as assessed by RNA-Seq. (F) Gene expression profile of the ISGs differentially expressed in TLR3-KO iPSC-derived cortical neurons, relative to parental control iPSC-derived cortical neurons. The heatmap shows the log fold-change in ISG expression, as assessed from 2 technical duplicates of the RNA-Seq, with red indicating upregulation and green downregulation. The error bars indicate the SEM (A–C) or SDs (D) of biological triplicates from 3 independent experiments. P values were obtained with (A–C) or without (D) log transformation followed by 1-way ANOVA and subsequent Tukey’s multiple comparison tests, by comparing TLR3–/– or TLR3-KO cortical neurons with controls, and the respective P values are indicated. *P < 0.05, **P < 0.01, ***P < 0.001, ****P < 0.0001.

