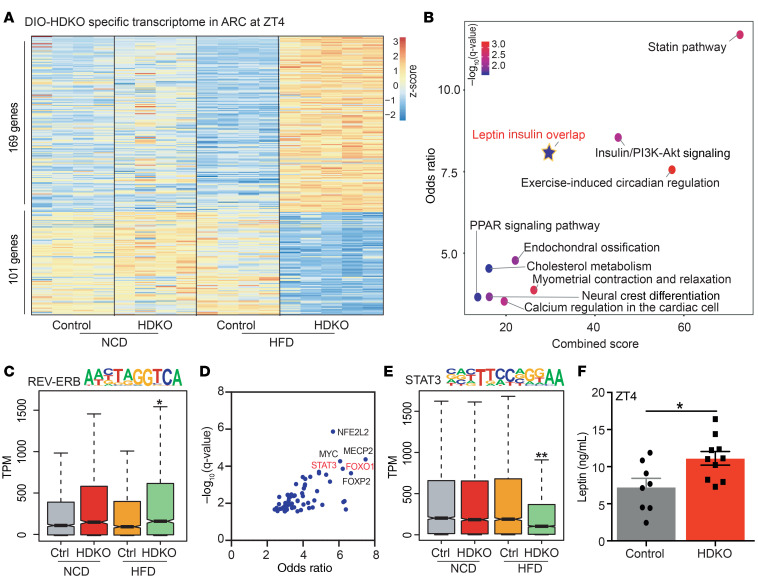
Figure 4. Food consumption is regulated by REV-ERB–dependent leptin signaling in the ARC on HFD.
(A) Heatmap of the genes differentially expressed in HDKO mice in the ARC only on HFD. Gene expression analysis at ZT4 from HDKO mice and their control littermates on NCD and HFD in the ARC (TPM > 0.1, FDR < 0.05). Two to 4 independent hypothalamic nuclei punches were pooled together per biological replicate (n = 4–5). (B) Pathway analysis of genes differentially expressed in HDKO mice on HFD in the ARC (Enrichr q value < 0.05). (C) Box-and-whisker plot showing minimum, maximum, median, first quartile, and third quartile from quantification of enrichment of the REV-ERB motif in the transcriptome from HDKO mice and their control littermates on NCD or HFD in the ARC. P values were calculated with the Mann-Whitney test. (D) Enrichr transcription factor analysis on the genes downregulated in HDKO mice on HFD in the ARC. (E) Box-and-whisker plot showing minimum, maximum, median, first quartile and third quartile from quantification of enrichment of the STAT3 motif in the transcriptome from HDKO mice and their control littermates on NCD or HFD in the ARC. P values were calculated with the Mann-Whitney test. (F) Leptin circulating levels at ZT4 in control and HDKO mice on HFD (n = 8–10, mean ± SEM). Results were compared by Mann-Whitney test. *P < 0.05, **P < 0.01.

