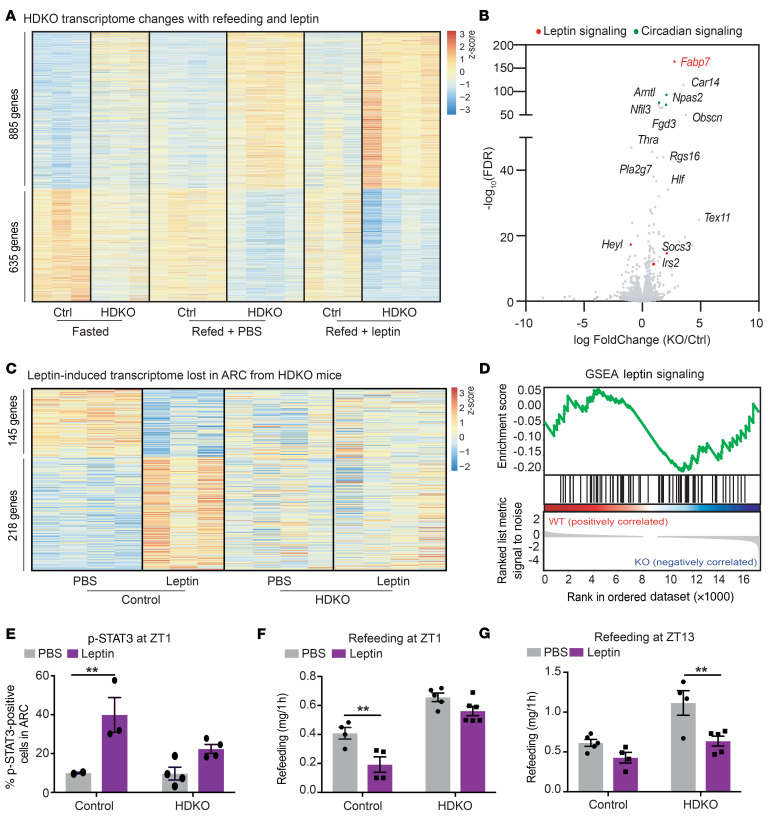
Figure 6. Hypothalamic REV-ERBs regulate diurnal leptin sensitivity on HFD.
(A) Heatmap of the genes differentially expressed in HDKO mice in the ARC in basal condition (fasted) and exacerbated during refeeding and leptin treatments. Gene expression analysis at ZT4 from HDKO mice and their control littermates after 24 hours of fasting and refeeding with HFD after injection of PBS or leptin (TPM > 0.1, FDR < 0.05). Two independent hypothalamic nuclei punches were pooled together per biological replicate (n = 3–4). (B) Volcano plot of the genes differentially expressed in HDKO mice identified in panel A, highlighting genes involved in circadian regulation (in green) or leptin signaling (in red). (C) Heatmap of the genes differentially expressed in HDKO mice in response to leptin. Gene expression analysis at ZT4 from HDKO mice and their control littermates after 24 hours of fasting and refeeding with HFD after injection of PBS or leptin (TPM > 0.1, FDR < 0.05). Two independent hypothalamic nuclei punches were pooled together per biological replicate (n = 3–4). (D) GSEA of leptin signaling during refeeding in response to leptin in the ARC from HDKO mice and their control littermates. (E) Percentage of p-STAT3–positive cells in the ARC after 24 hours of fasting, and PBS or leptin injection at ZT1 in HDKO mice and their control littermates on HFD (n = 2–4, mean ± SEM). Results were compared by 2-way ANOVA (interaction P = 0.1187) and Holm-Šidák multiple-comparison test. (F and G) Rebound feeding on HFD at ZT1 (F) and ZT13 (G) after 24 hours of fasting and injection of PBS or leptin in HDKO mice and their control littermates (n = 4-6, mean ± SEM). A representative experiment is shown at ZT1 (of 2 separate experiments with similar results). Results were compared by 2-way ANOVA and Holm-Šidák multiple-comparison test. **P < 0.01.

