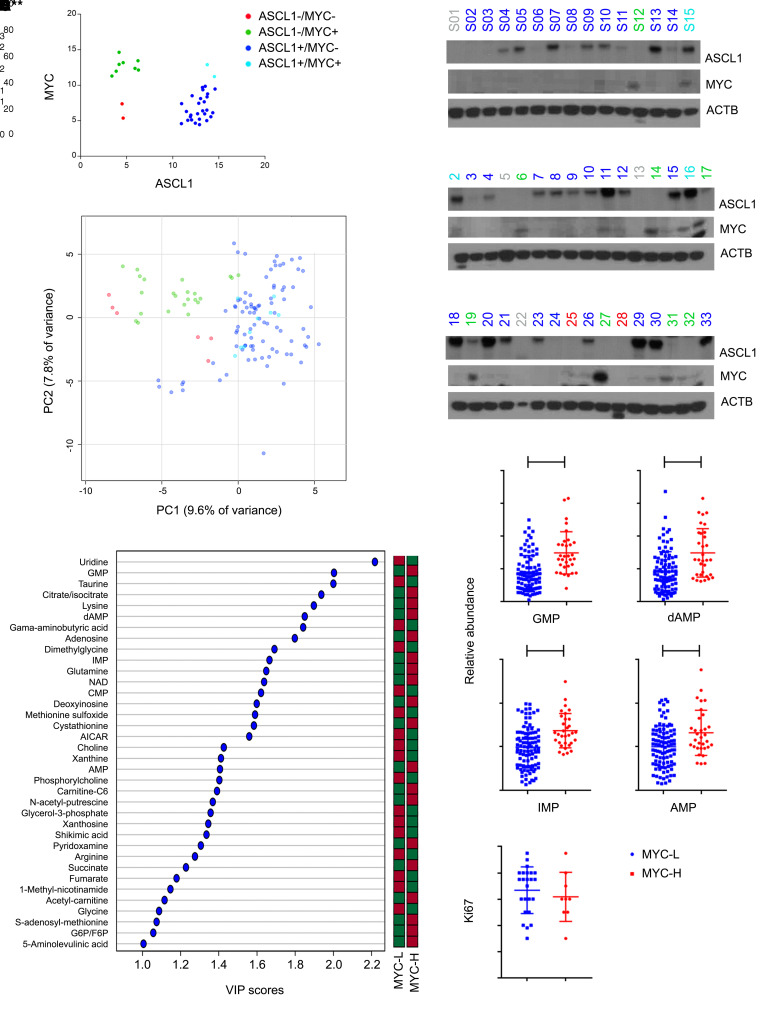
Figure 1. Distinct metabolomic subsets of primary human SCLC.
(A and B) Protein abundance of ASCL1 and MYC in tumors from treatment-naive SCLC patients. Tumors labeled gray in B were excluded from further study owing to inadequate metabolite content. (C) Principal component analysis of metabolomics in tumors from A. Individual data points are displayed for 3 fragments from each tumor. (D) Metabolites discriminating between MYChi and MYClo tumors. These metabolites have variable importance in the projection (VIP) scores over 1.0, indicating statistically significant differences between the groups. The bar indicates whether each metabolite is more (red) or less abundant (green) in each group. (E) Relative abundance of purines in MYChi and MYClo tumors. Individual data points are shown with mean and SD for 3 fragments from each tumor. **P < 0.01, ***P < 0.001, ****P < 0.0001. (F) Ki67 values from 33 tumors. Individual data points are shown with mean and SD. Statistical significance was assessed using a 2-tailed Student’s t test (E). Metabolomics was performed once. All other experiments were repeated twice or more.

