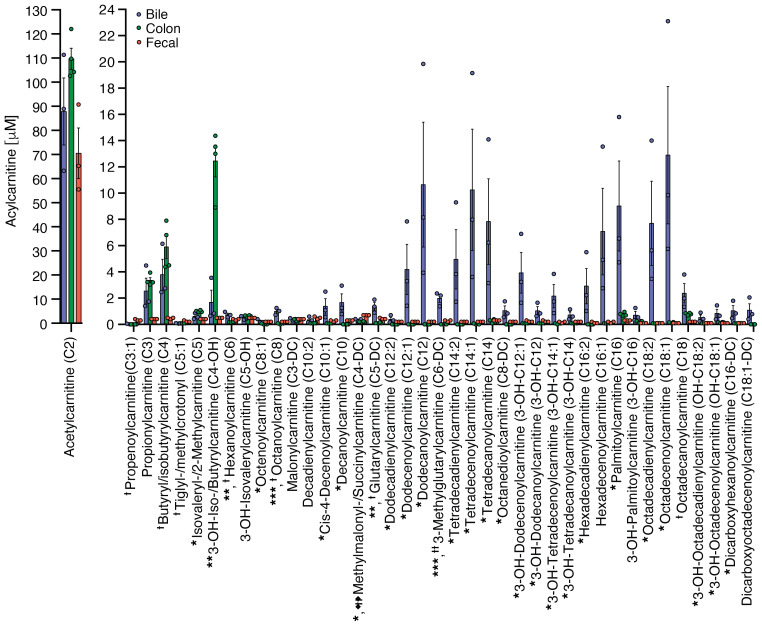
Figure 2. Quantification of acylcarnitine levels in bile (n = 3), colonic tissue (n = 4), and fecal pellets (n = 3) from conventionally housed mice.
*Bile compared to colon, *P < 0.05, **P < 0.01, ***P < 0.001; †Bile compared to fecal, †P < 0.05, ††P < 0.01, †††P < 0.005. P values represent a 2-tailed Student’s t test and paired-sample t test.

