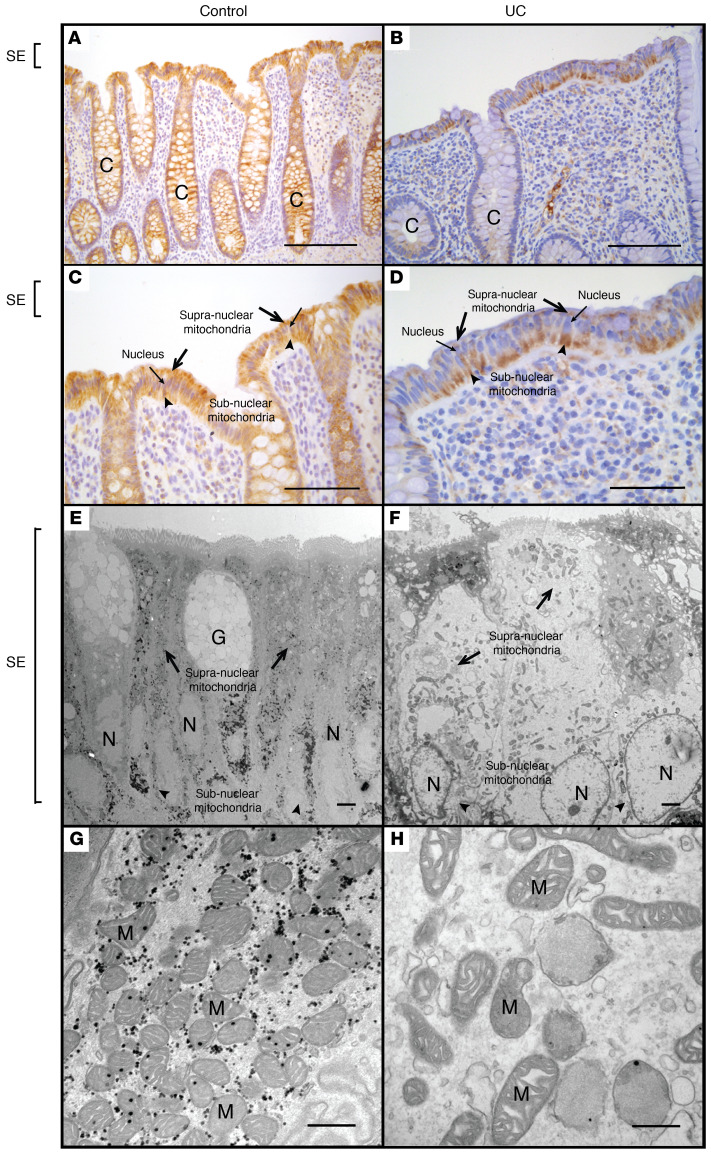
Figure 6. Comparative morphological analysis of colonic epithelial mitochondria in healthy human subjects versus patients with IBD.
MTCO1 staining of colonic tissue obtained from a representative healthy (control) human subject (A and C) and a representative patient with IBD (UC) (B and D). Electron microscopy of the superficial colonic epithelium obtained from a representative healthy human subject (E and G) and a representative patient with IBD (UC) (F and H). Scale bars: 400 μm (A and B), 200 μm (C and D), 2 μm (E and F), 500 nm (G and H). Symbols: crypt (C), goblet cell (G), nucleus (N), surface epithelium (SE), mitochondria (M), supranuclear mitochondria (black arrows), subnuclear mitochondria (black arrowheads).

