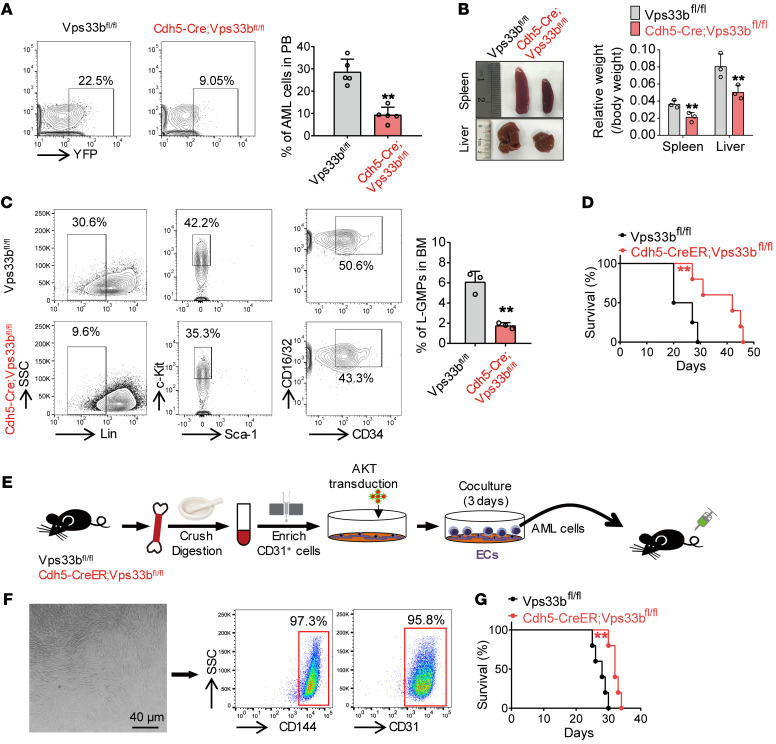
Figure 3. EC-SEVs support leukemia development.
(A) Flow cytometry (left) and histogram (right) analysis of the percentage of YFP+ leukemia cells in the peripheral blood (PB) of recipients 20 days after transplantation (n = 5; the data represent the means ± SD; **P < 0.01, Student’s t test). (B) Recipient spleen and liver size (left) and weight (right) 20 days after transplantation (n = 3; the data represent the means ± SD; **P < 0.01, Student’s t test). (C) Flow cytometry (left) and histogram (right) analysis shows the percentages of L-GMP cells in the BM of recipients (n = 3; the data represent the means ± SD; **P < 0.01, Student’s t test). (D) Survival curves of Cdh5-CreER;Vps33bfl/fl mice and Vps33bfl/fl control mice after AML cell injection (n = 4–5; **P < 0.01, log-rank test). (E) The experimental procedure for BM EC isolation and coculture with AML cells. In brief, BM from Cdh5-CreER;Vps33bfl/fl mice or Vps33bfl/fl control mice was crushed and digested, and enriched using anti-CD31 beads. The enriched ECs were transduced with AKT lentiviruses and cocultured with AML cells for 3 days. After coculture, the AML cells were injected into C57BL/6J recipients. (F) Left: The morphology of the enriched and cultured ECs. Scale bar: 40 μm. Right: Flow cytometry analysis to determine the purity of cultured ECs. (G) Survival curves of C57BL/6J recipients injected with AML cells cocultured with WT ECs or Vps33b-null ECs (n = 5; **P < 0.01, log-rank test). Experiments were conducted 2–4 times for validation.

