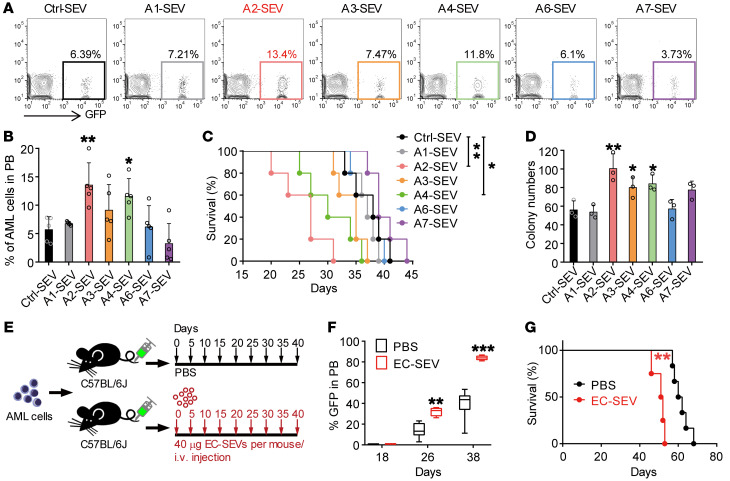
Figure 6. ANGPTL2-SEVs from ECs support leukemia development.
(A and B) Flow cytometry (A) and histogram (B) analysis of the percentages of GFP+ leukemia cells in the PB of recipients 16 days after transplantation (n = 5; the data represent the means ± SD; *P < 0.05, **P < 0.01, 1-way ANOVA followed by Dunnett’s test). Ctrl, control. (C) Survival analysis of recipients injected with AML cells cocultured with the indicated SEVs (n = 5; *P < 0.05, **P < 0.01, log-rank test). (D) The colony-forming ability of AML cells cocultured with the indicated SEVs (n = 3; the data represent the means ± SD; *P < 0.05, **P < 0.01, 1-way ANOVA followed by Dunnett’s test). (E) The in vivo administration of EC-SEVs. Equal volumes of PBS or EC-SEVs (40 μg) were intravenously injected every 5 days for 40 days. (F) The percentages of GFP+ leukemia cells in the PB of the recipients at indicated time points (n = 4–6; **P < 0.01, ***P < 0.001, Student’s t test). (G) Survival curves of AML recipients injected with PBS or EC-SEVs (n = 4–6; **P < 0.01, log-rank test). Experiments were conducted 2–3 times for validation.

