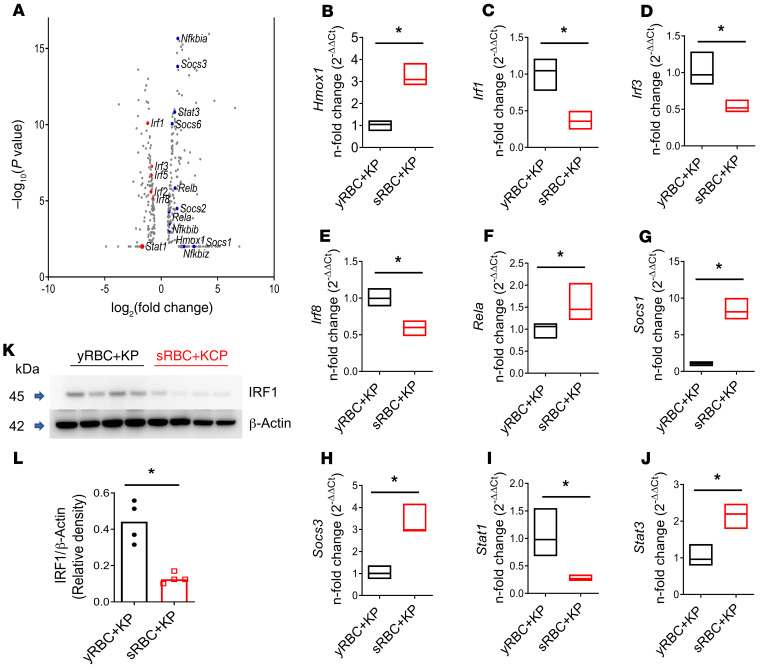
Figure 3. RNA-Seq of the liver in mice after sRBC delivery reveals a unique transcriptomic profile notable for suppression of Stat1 and IFN-related responses during K. pneumoniae infection.
KP was instilled intratracheally into C57BL/6 mice followed by challenge with either yRBCs or sRBCs. Mice were euthanized at 24 hours. (A) Volcano plot of innate immune genes. Red depicts downregulated genes. Blue depicts upregulated genes. (B–J) qPCR validation of RNA-Seq data. Floating bar plots indicate median and 25% to 75% quartiles. n = 4 mice per group. *P < 0.05 by 2-tailed Mann-Whitney U test. Fold change relative to yRBC + KP. (K) IRF1 immunoblot in livers of KP-infected mice challenged with either yRBCs or sRBCs. Each line indicates individual mice. (L) Relative density of blot depicted in K. n = 4 mice per group, line indicates the median. *P < 0.05 by 2-tailed Mann-Whitney U test.

