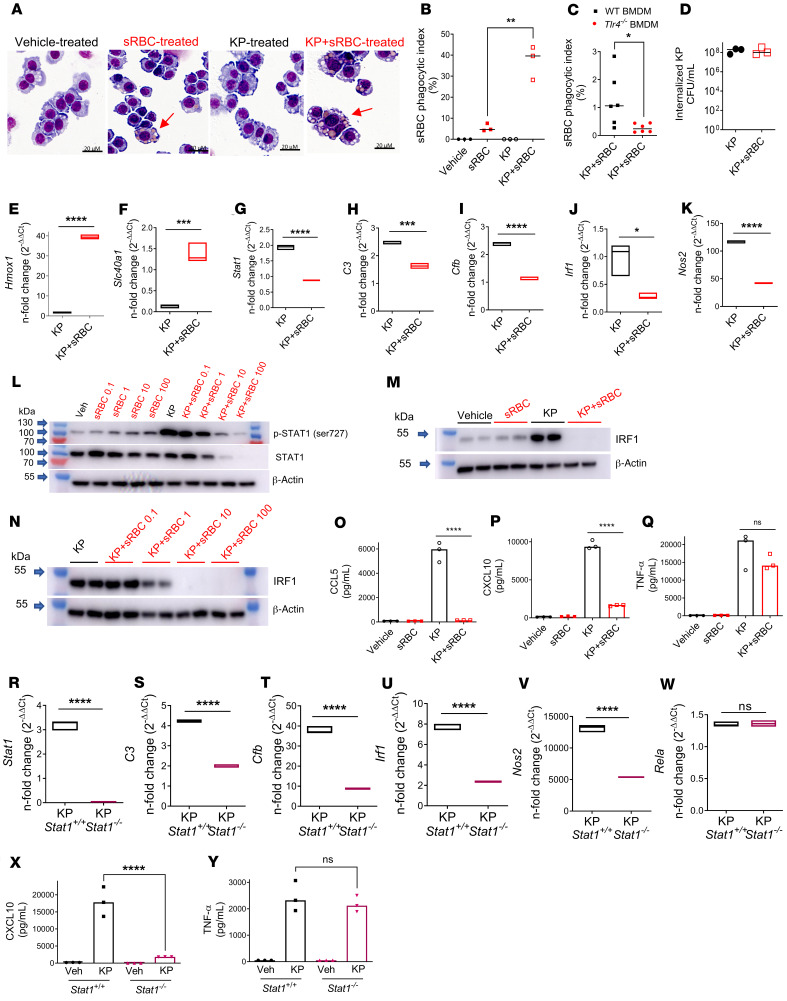
Figure 4. K. pneumoniae enhances erythrophagocytosis, leading to upregulation of heme iron transcriptional responses and suppression of STAT1.
(A) sRBC internalization in RAW cells incubated with vehicle (PBS), sRBCs (50 sRBC:1 Mφ), KP (MOI 10:1), or KP + sRBC for 90 minutes. (B) Quantification of sRBC uptake shown in A. (C) Bone marrow–derived macrophages (BMDMs) obtained from WT and Tlr4–/– mice were challenged with KP + sRBC (10sRBC:1 Mφ) for 2 hours. (B and C) n = 3 technical replicates per group and data are indicative of 2 independent experiments. *P < 0.05, **P < 0.01 by 2-tailed t test. (D) Intracellular CFU/mL in RAW cells that were challenged with KP or KP + sRBC for 90 minutes. (E and F) Heme iron transcriptional genes Hmox1, Scl40a1, and (G–K) Stat1 and STAT1 target genes C3, Cfb, Irf1, and Nos2 evaluated in RAW cells challenged with KP or KP + sRBC for 4 hours. (L–N) STAT1 and IRF1 immunoblots in RAW cells challenged with vehicle (PBS), sRBCs, KP, or KP + sRBC for 4 hours. Blots are indicative of at least 3 independent experiments. (O–Q) CCL5, CXCL10, and TNF-α were measured in cell culture supernatant by ELISA 4 hours after infection. (R–W) Stat1, C3, Cfb, Irf1, Nos2, and Rela in Stat1+/+ and Stat1–/– BMDMs challenged with KP or KP + sRBC for 4 hours. (E–K and R–W) Gene expression was evaluated by qPCR analysis. Fold change is relative to PBS-treated macrophages. Floating bar plots indicate median and 25% to 75% quartiles, n = 3 technical replicates per group. *P < 0.05, ***P < 0.001, ****P < 0.0001 by 2-tailed t test. (X and Y) CXCL10 and TNF-α were measured in cell culture supernatant by ELISA 4 hours after infection. (O–Q, X, and Y) n = 3 technical replicates per group. ****P < 0.0001 by 1-way ANOVA with Tukey’s multiple comparisons test.

