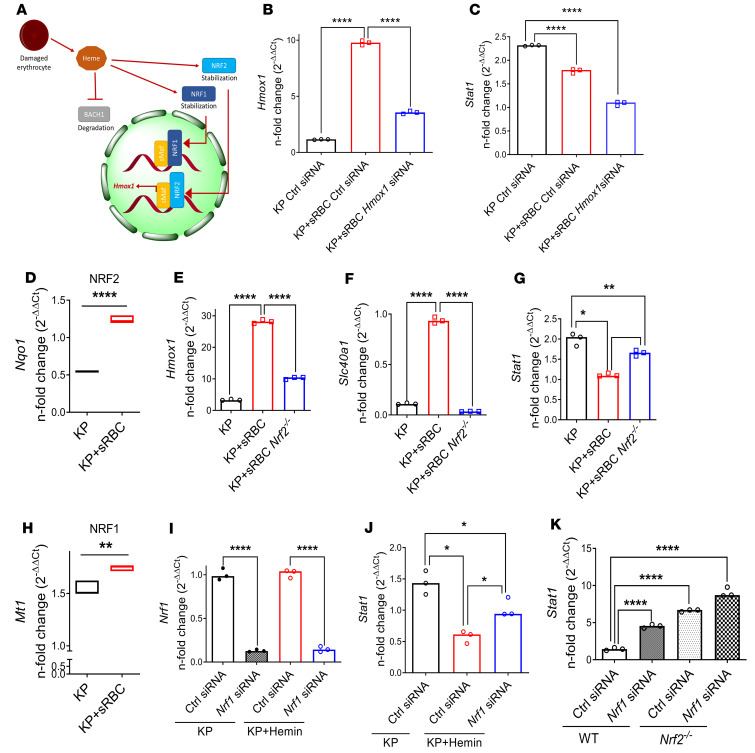
Figure 6. STAT1 suppression requires NRF1 and NRF2 activation but is independent of HO-1 induction.
(A) Schematic depicting heme-BACH1-NRF1/2 interaction. Intracellular heme accumulation after erythrophagocytosis induces degradation of BACH1 and stabilization of NRF1 and NRF2, with nuclear translocation of NRF2 resulting in Hmox1 transcription. (B) Hmox1 and (C) Stat1 gene expression in RAW cells transfected with control or Hmox1 siRNA and subsequently challenged with KP or KP + sRBC for 4 hours. (B and C) Fold change relative to uninfected control siRNA-transfected RAW cells. Data are average of 3 independent experiments. (D) NRF2 target gene (Nqo1) expression in RAW cells challenged with KP or KP + sRBC for 4 hours. (E–G) Hmox1, Slc40a1, and Stat1 expression in BMDMs obtained from WT and Nrf2–/– mice challenged with KP or KP+ RBC for 4 hours. Fold change relative to PBS-treated BMDMs. (H) NRF1 target gene (Mt1) expression in RAW cells challenged with KP or KP + sRBC for 4 hours. **P < 0.01, ****P < 0.0001 by 2-tailed t-test (D and H). (I) Nrf1 and (J) Stat1 expression in BMDMs transfected with control siRNA or Nrf1 siRNA and subsequently challenged with KP or KP + hemin (50 μM) for 4 hours. (D–K) n = 3 technical replicates per group, and representative of at least 2 independent experiments. (K) Stat1 expression in BMDMs obtained from WT and Nrf2–/– mice, transfected with control siRNA or Nrf1 siRNA, and subsequently challenged with KP for 4 hours. (I–K) Fold change relative to uninfected control siRNA-transfected BMDMs. *P < 0.05, **P < 0.01, ***P < 0.001, ****P < 0.0001 by 1-way ANOVA with Tukey’s multiple comparisons test (B, C, E–G, and I–K).

