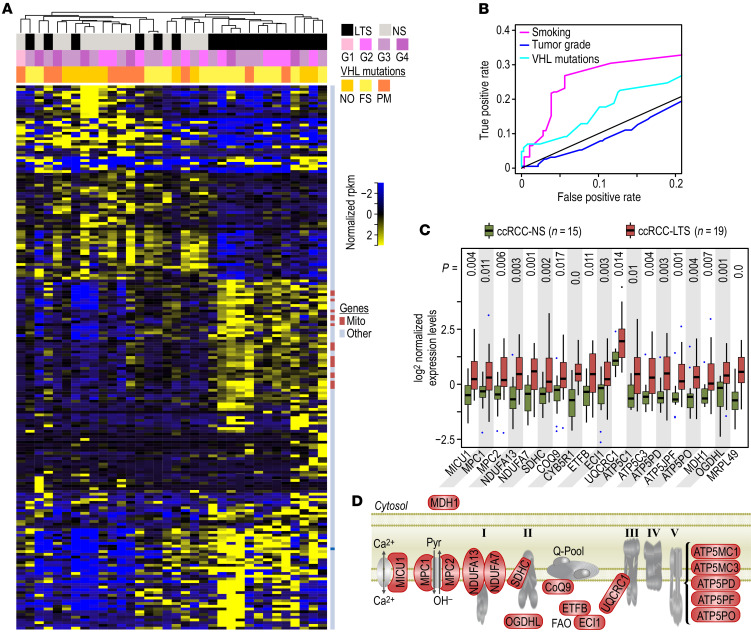
Figure 1. Identification of genes differentially regulated by TS in ccRCCs.
(A) Heatmap of all differentially regulated genes shows stratification with TS (marked by black in the top bar). Pink bar represents tumor grades, and yellow bar represents mutations in VHL (WT: wild type, PM: point mutations, FS: frameshift mutations). Dark blue marks in the bar on the right of the heatmap indicate mitochondrial genes induced in the ccRCCs from LTS. (B) ROC curves for the classification of the samples into classes defined by TS (magenta), tumor grade (blue), or VHL mutation status (cyan). Random classifier is drawn as a diagonal gray line, and classification accuracy is represented by the AUC indicating that observed clustering provides the best classification for TS status. (C) Box-whisker plots for expression of mitochondrial genes in ccRCCs from NS and LTS. The boxes represent lower and upper quartiles separated by the median (thick horizontal line) and the whiskers extend to the minimum and maximum values, excluding points that are outside the 1.5 IQR from the box (marked as circles). P values from Mann-Whitney-Wilcoxon test are provided at the top. (D) Model showing localization of the 18 induced genes (marked in red) in the context of mitochondrial electron transport chain. ccRCCs from 15 NS and 19 LTS were analyzed.

