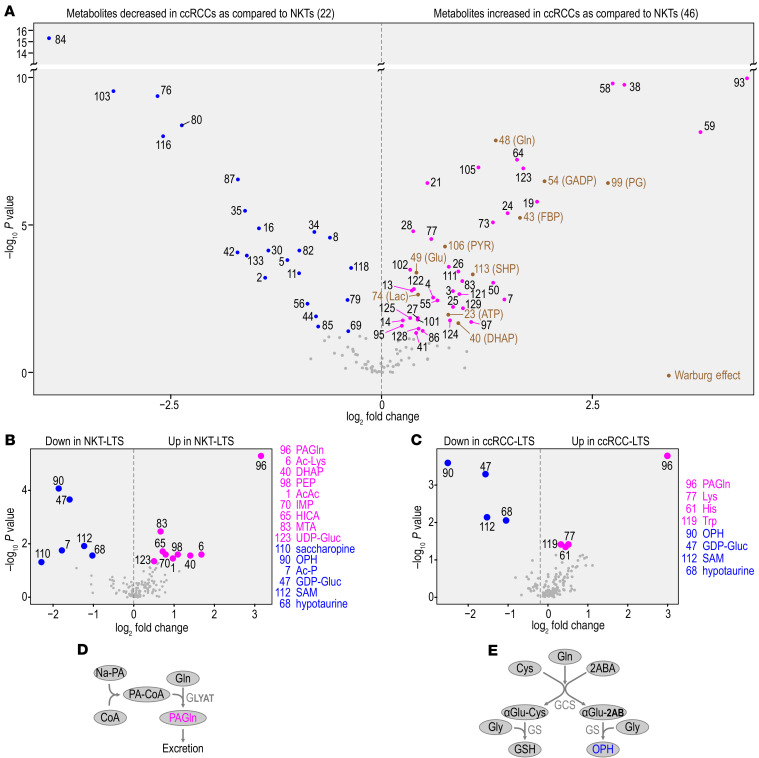
Figure 2. Metabolic profiling of ccRCCs and NKTs from LTS and NS.
(A) Volcano plot shows metabolites with differential abundance (P < 0.05, fold change, Wilcoxon nonparametric test) between all NKTs (n = 36) and all ccRCCs (n = 37). Differentially abundant metabolites are labeled by numbers (see Supplemental Table 5B for the identification of the indicated metabolites). Intermediates of the Warburg effect labeled in brown. (B) Volcano plots show metabolites with differential abundance in NKTs from LTS compared with NS. (C) Volcano plots show metabolites with differential abundance in ccRCCs from LTS compared with NS. (D) Pathway for metabolism of phenylacetylglutamine (PAGln). (E) Pathway of OPH and GSH biosynthesis.

