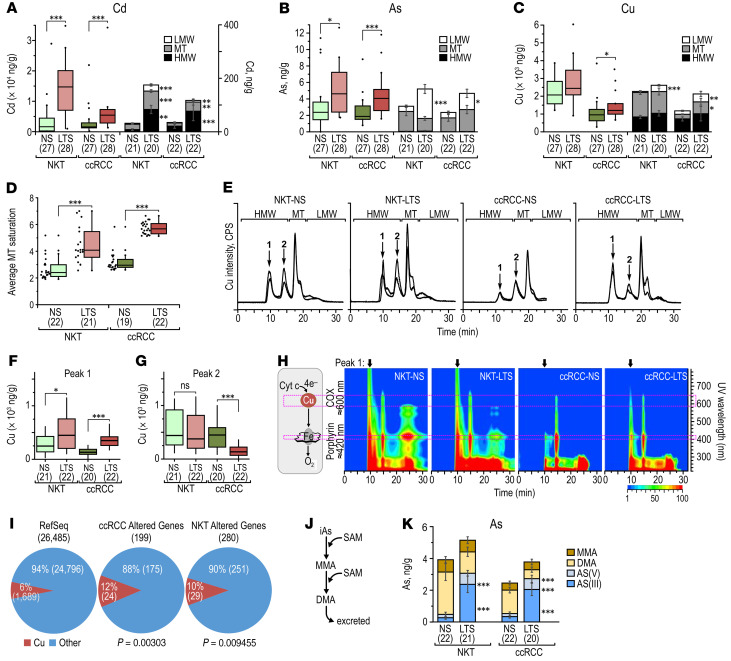
Figure 7. Metallomic analysis of TS effects in NKTs and ccRCCs from NS and LTS.
(A) Box-whisker plots for the total Cd content and stacked bar graphs for Cd distribution for NKTs and ccRCCs from NS and LTS. (B) Box-whisker plots for the total As content and stacked bar graphs for As distribution for NKTs and ccRCCs from NS and LTS. (C) Box-whisker plots for the total Cu content and stacked bar graphs for Cu distribution for NKTs and ccRCCs from NS and LTS. (D) Saturation of MTs in the indicated tissues. (E) SEC-ICP-MS chromatograms from indicated tissues. Y-axis on the left represents the intensity of signal for the metals. HMW: high molecular weight fraction, LMW: low molecular weight fraction, MT: metallothioneins. Peak 1 corresponds to Cu bound to cytochrome oxidase C, and peak 2 to Cu bound to other proteins. (F) Quantification of Cu in the fraction corresponding to cytochrome C oxidase peak 1 in the indicated tissues. (G) Quantification of Cu in the fraction corresponding to peak 2 in the indicated tissues. (H) UV-Vis isoabsorbance plots. The specific absorption bands at 420 and 600–700 nm are respectively specific for porphyrin rings and CuA-red and CuB-Ox clusters. Scale:1–100 mAU log10. (I) Pie charts show proportion of genes encoding proteins using Cu among the protein-coding genes in RefSeq database and among differentially expressed genes in NKTs and ccRCCs from NS and LTS. P values were determined by 2-sample test for equality of proportion with continuity correction. (J) Schematic representation of As methylation pathway. (K) Stacked bar graphs showing speciation of As in the indicated tissues. MMA: monomethylated As; DMA: demethylated As. P values calculated by Mann-Whitney-Wilcoxon test. Numbers in parentheses indicate number of samples used in each experiment.

