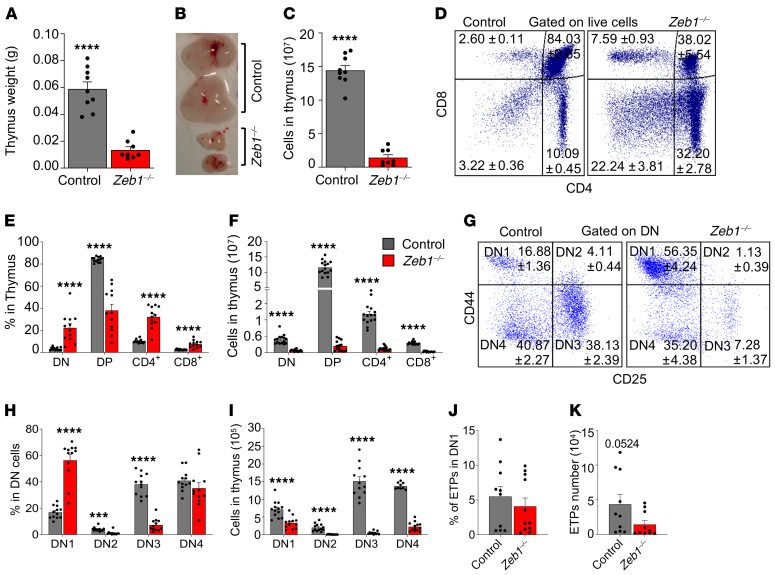
Figure 2. Loss of Zeb1 results in T cell reduction in thymus associated with early differentiation defects in thymus.
Thymus weight (A), representative photograph (B), and total thymus cellularity (C) from control (n = 9) and Zeb1–/– (n = 8) mice from 5 independent experiments at day 14 after the last pIpC dose. (D) Representative FACS plots of T cell analysis in thymus based on CD4 and CD8 cell-surface markers (DN: CD4–CD8–, DP: CD4+CD8+, CD4+, CD8+). (E) Frequency of T cell subsets in thymus from control (n = 13) and Zeb1–/– (n = 12) mice from 6 independent experiments at day 14 after the last pIpC dose. (F) Total cell count of T cell subsets in thymus from control (n = 14–15) and Zeb1–/– (n = 14–15) mice from 7 independent experiments at day 14 after the last pIpC dose. (G) Representative FACS plots showing gating strategy of early stages within CD4+CD8+ DN population using CD25 and CD44 (DN1: CD44+CD25–, DN2: CD44+CD25+, DN3: CD44–CD25+, DN4: CD44–CD25–) between control and Zeb1–/– at day 14 after the last pIpC dose. (H) Frequency of DN populations (DN1, DN2, DN3, DN4) in DN cells from control (n = 12) and Zeb1–/– (n = 12) mice from 5 independent experiments at day 14 after the last pIpC dose. (I) Total cell count of DN populations in thymus from control (n = 9-13) and Zeb1–/– (n = 11–13) mice from 4 independent experiments at day 14 after the last pIpC dose. (J) Frequency and (K) total count of ETPs (DN1 cKithi) from control (n = 10) and Zeb1–/– (n = 10–11) mice from 4 independent experiments at day 14 after last pIpC dose. Error bars show mean ± SEM. Mann-Whitney U test was used to calculate significance. ***P < 0.001; ****P < 0.0001.

