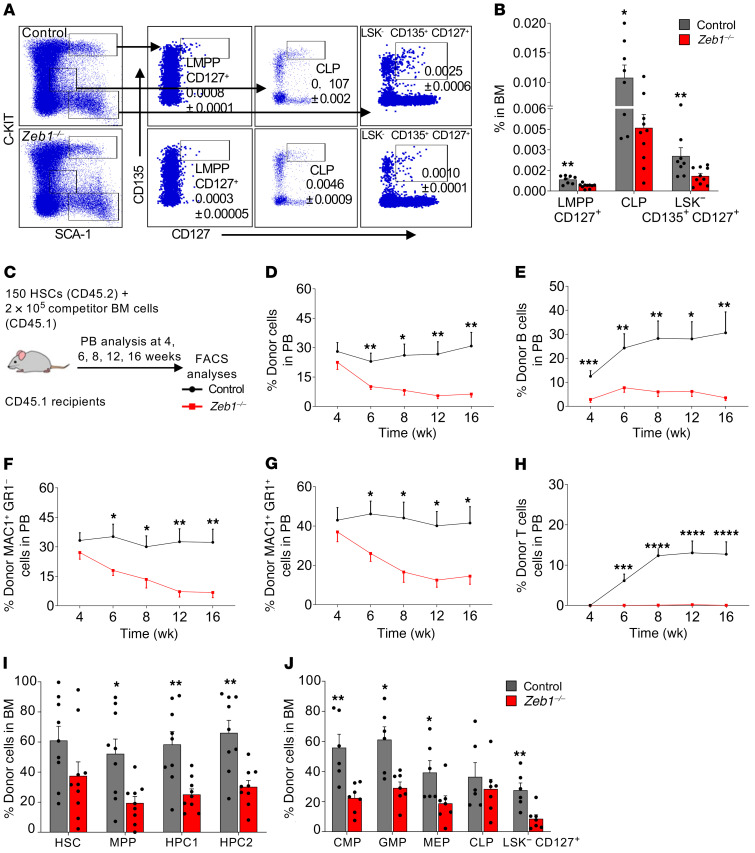
Figure 3. Loss of Zeb1 results in a reduction of lymphoid progenitors in BM and a multilineage hematopoietic differentiation defect after HSC transplantation.
(A) Representative FACS plots of the analysis of LMPP CD127+ (nonconventional LMPP: LSK CD135+CD127+), CLP (LIN– SCA-1loC-KITloCD135+CD127+), and LSK–CD127+CD135+ 14 days after the last dose of pIpC. (B) Frequency of LMPP CD127+, CLP, and LSK–CD 127+CD135+ in the BM from control (n = 8) and Zeb1–/– (n = 10) mice from 4 independent experiments at day 14 after the last pIpC dose. (C) Schematic of competitive HSC transplantation. 150 HSCs from control or Zeb1–/– mice (donor CD45.2) mixed with 2 × 10⁵ BM competitor cells (CD45.1) were transplanted into lethally irradiated recipients (CD45.1), and the mice were monitored by bleeding the tail vein at different time points until week 16. (D) Percentage of donor cells in PB at different time points after HSC transplantation from control (n = 10) and Zeb1–/– (n = 10) mice from 3 independent experiments. Analysis of PB donor contribution to B cells (B220+) (E), MAC1+GR1– myeloid cells (F), MAC1+GR1+ myeloid cells (G), and T cells (CD4+CD8+) (H) from control (n = 10) and Zeb1–/– (n = 8–10) mice from 3 independent experiments. Donor contribution to BM HSPCs (I) (HSC: LSK CD150+CD48–, MPP: LSK CD150–CD48–, HPC1: LSK CD150–CD48+, HPC2: LSK CD150+CD48+) from control (n = 9) and Zeb1–/– (n = 9) from 3 independent experiments and BM committed progenitors (J) (CMP: LK CD34+CD16/32–, GMP: CD34+CD16/32+, MEP: CD34–CD16/32–, CLP: LIN– SCA-1loC-KITloCD127+, and LSK–CD127+ from control (n = 6) and Zeb1–/– (n = 7) from 2 independent experiments. Error bars show mean ± SEM. Mann-Whitney U test was used to calculate significance. *P < 0.05; **P < 0.01; ***P < 0.001; ****P < 0.0001.

