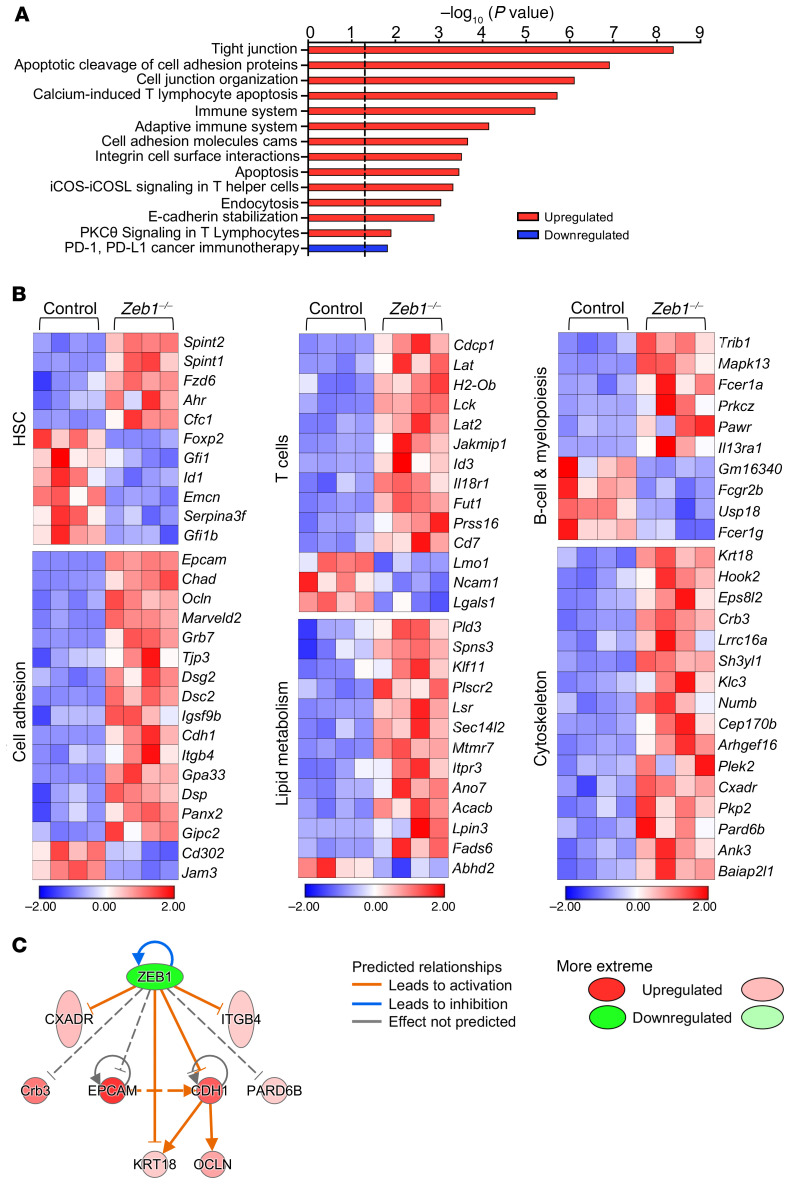
Figure 5. Zeb1–/– HSCs display deregulation of hematopoietic function and cell polarity transcriptional programming.
RNA-Seq was performed in sorted control and Zeb1–/– HSCs (LSK CD150+CD48–) 14 days after last pIpC dose (n = 4 for each genotype). (A) Biological pathway analysis shows the top enriched pathways in Zeb1–/– HSCs compared with control. Data are shown as –log10 (P value), and the dashed black line indicates P value of 0.05. (B) Heatmaps of the DEGs after Zeb1 deletion related to HSC function, T cells, and B cells as well as cytoskeleton, lipid metabolism, and cell adhesion. Heatmap scale represents z score. (C) A network of Zeb1 interaction with several target genes related to polarity, cytoskeleton, and cell adhesion using IPA software. Due to their confirmed binding to ZEB1 in the literature, Epcam, Pard6b, and Crb3 were added manually.

