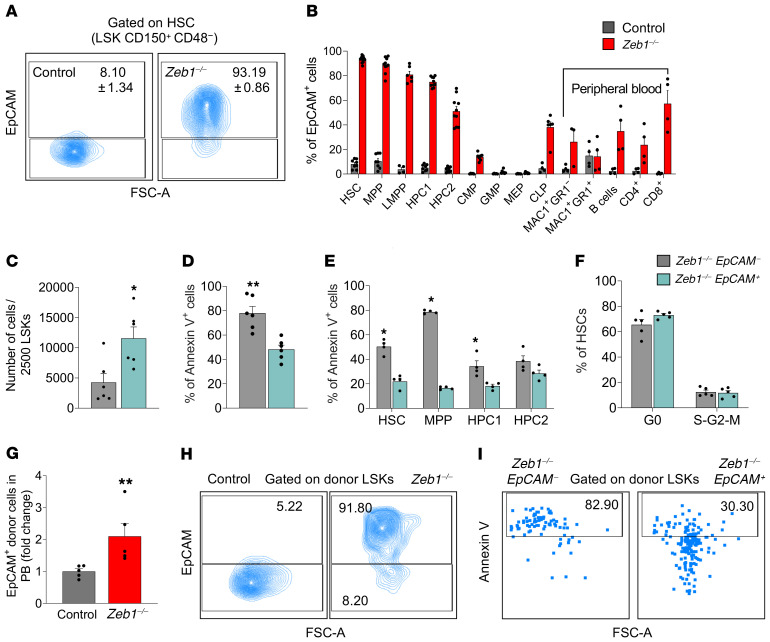
Figure 6. Increased EpCAM expression confers survival advantage and differentiation block in Zeb1–/– HSCs.
(A) Representative flow cytometry plots of EpCAM expression in HSCs 14 days after pIpC injection. (B) Analysis of EpCAM expression in BM subpopulations and PB mature cells 14 days after pIpC injection from control (n = 8 for HSC, MPP, HPC1, and HPC2; n = 4 for LMPP, CLP and mature PB populations; n = 5 for CMP, GMP, and MEP) and Zeb1–/– (n = 10 for HSC, MPP, HPC1, and HPC2; n = 6 for LMPP and CLP; n= 4 for mature PB populations except MAC1+GR1– n = 3; n = 7 for CMP, GMP, and MEP). (C) Cell number after culturing 2500 LSKs from Zeb1–/– EpCAM– (n = 6) and Zeb1–/– EpCAM+ (n = 6) from 3 independent experiments. (D) Analysis of apoptosis in LSKs after culture from Zeb1–/– EpCAM– (n = 6) and Zeb1–/– EpCAM+ (n = 6) from 3 independent experiments. (E) Analysis of apoptosis in fresh BM HSPCs 14 days after pIpC injection from Zeb1–/– EpCAM– (n = 4) and Zeb1–/– EpCAM+ (n = 4) from 2 independent experiments. (F) Cell cycle analysis of HSCs using Ki67 and DAPI 14 days after pIpC injection from Zeb1–/– EpCAM– (n = 5) and Zeb1–/– EpCAM+ (n = 5) from 1 experiment. (G) Analysis of EpCAM expression in donor PB at week 16 after primary HSC transplantation from control (n = 5) and Zeb1–/– (n = 5) from 1 experiment represented as fold change. (H) Representative FACS plots of the analysis of EpCAM expression in LSKs 16 weeks after primary HSC transplantation from control (n = 2) and Zeb1–/– (n = 1) from 1 experiment. (I) Representative FACS plots of the analysis of apoptosis using annexin V in EpCAM-negative and -positive fractions within donor LSKs 16 weeks after primary HSC transplantation from control (n = 2) and Zeb1–/– (n = 1) from 1 experiment. Error bars show mean ± SEM. Mann-Whitney U test was used to calculate significance. *P < 0.05; **P < 0.01.

